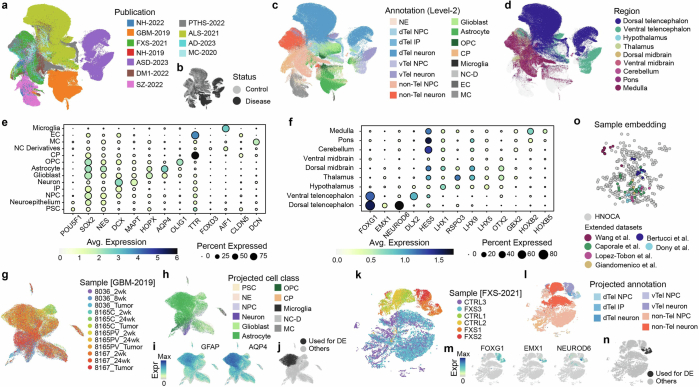
Extended Data Fig. 10. Disease-modeling neural organoid scRNA-seq atlas and data projection based extension of HNOCA.
(a-c) UMAP of the unintegrated disease-modeling neural organoid atlas, colored by (a) publications, (b) disease status, (c) transferred level-2 annotation from HNOCA, and (d) transferred regional identities from HNOCA. (e) Dot plot shows expression of selected cell type markers in cells with different transferred cell class labels (level-1) from HNOCA. (f) Dot plot shows expression of selected regional markers in the predicted NPCs and neurons in the disease-modeling atlas with different transferred regional identities from HNOCA. In both (e) and (f), sizes of dots represent percentages of cells expressing the gene, and colors of dots represent the average expression levels. (g-j) UMAP of the glioblastoma GBM-2019 data set, colored by (g) samples, (h) predicted cell class labels (level-1) from the HNOCA projection, (i) expression of astrocyte markers GFAP and AQP4, and (j) the AQP4+ population selected for DE analysis with HNOCA. (k-n) UMAP of the fragile X syndrome FXS-2021 data set, colored by (k) samples, (l) predicted cell type annotation (level-2) from the HNOCA projection, (m) expression of dorsal telencephalic cell markers FOXG1, EMX1 and NEUROD6, (n) the dorsal telencephalic NPC and neuron subset for DE analysis with HNOCA. (o) PCA of the scPoli sample embeddings of samples in HNOCA and five additional data sets projected to HNOCA.

