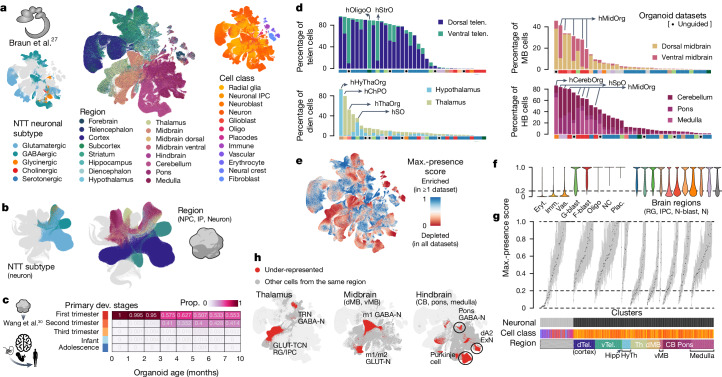
Fig. 2. Projection of HNOCA to primary developing human brain cell atlases assists organoid neural cell type annotation and estimation of primary cell type representation.
a, UMAP of a human developing brain cell atlas27, coloured by NTT subtypes (left), region (middle) and annotated cell classes (right). b, UMAP of HNOCA, coloured by the mapped neuron NTT subtypes (left) and regional labels of NPCs, intermediate progenitor cells (IP) and neurons. c, Heatmap showing proportions of cells from organoids of different ages matched to cells from different primary developmental (dev.) stages. d, Percentages of neural cells representing different regions (telencephalon, diencephalon, midbrain and hindbrain) in different datasets. The x axes show datasets, descendingly ordered by the total proportions (bar height). Datasets based on unguided differentiation protocols are marked by dots underneath. The bars at the bottom of each panel show organoid protocol types. e, UMAP of the human developing brain cell atlas27 coloured by cell population presence within HNOCA datasets (max presence score). A low score denotes under-representation of cell state in HNOCA datasets. f, Distribution of max presence scores of different cell classes in the human reference atlas27. Eryt., erythrocyte; Imm., immune; Vas., vascular; G-blast, glioblast; F-blast, fibroblast; NC, neural crest; Plac., placodes; RG, radial glia; IPC, intermediate progenitor cell; N-blast, neuroblast; N, neuron. g, Box plots showing distribution of max presence scores in different primary reference cell clusters. Bottom side bars show neuronal versus non-neuronal, cell class, region information of primary reference. h, UMAP of human developing brain atlas showing primary neural cell types or states under-represented in HNOCA (in red). Hippo, hippocampus; HyTh, hypothalamus; d, dorsal; v, ventral; CB, cerebellum.

