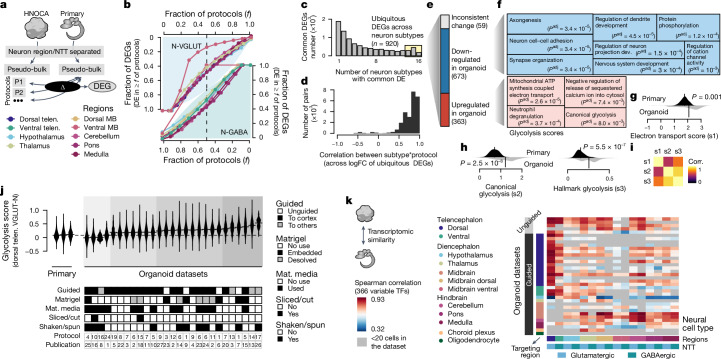
Fig. 3. Transcriptomic comparison between organoid neurons and their primary counterpart reveals universal cell stress in organoids.
a, Schematic of DE analysis comparing neural cell types in different protocols in HNOCA to their primary counterparts27. b, Proportions of expressed genes in different neural cell types that show DE in certain fractions of protocols that generate the corresponding subtypes. Top left, glutamatergic neurons; bottom right, GABAergic neurons. Colour shows the brain region. c, Numbers of protocol-common DEGs (DE in at least half of protocols), grouped by the number of neural cell types in which a gene is DE. d, Distribution of expression log-fold-change (logFC) correlation of ubiquitous DEGs among different neuron subtype*protocol (that is, each of the neural cell types generated by each of the different protocols). e, Numbers of DEGs per category. f, Gene ontology enrichment analysis of downregulated (upper, blue) and upregulated (lower, red) ubiquitous DEGs. Sizes of the squares correlate with −log-transformed adjusted P values. g,h, Distribution of the mitochondrial ATP synthesis-coupled electron transport module scores (g), canonical glycolysis module scores (h, left) and the Molecular Signatures Database hallmark glycolysis module scores (h, right), in primary neural cell types (upper, dark) and organoid counterparts (lower, light). P values, significance of a two-sided Wilcoxon test. i, Heatmap shows pairwise correlation (corr.) of the three module scores. j, Hallmark glycolysis score of dorsal telencephalic excitatory neurons (dTelen VGLUT-N), split by the three primary developing human brains and 27 organoid datasets with at least 20 dTelen VGLUT-N. The lower panel shows selected features of differentiation protocols that may be relevant to cell stress. The protocol and publication indices are shown in Extended Data Fig. 1. Mat. media, maturation media. k, Spearman correlations between gene expression profiles of neural cell types in HNOCA and those in the human developing brain atlas27, across the variable transcription factors (TFs). Datasets are in the same order as in Supplementary Table 1.

