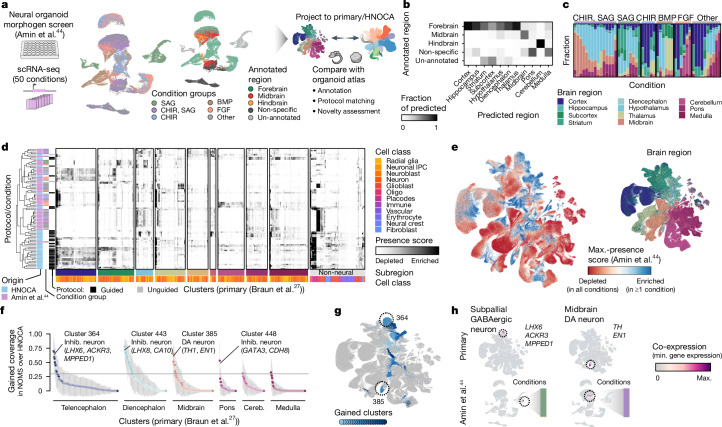
Fig. 4. Projection of neural organoid morphogen screen scRNA-seq data to HNOCA and human developing brain atlas allows cell type annotation and organoid protocol evaluation.
a, Schematic of projecting neural organoid morphogen screen44 scRNA-seq data to the HNOCA, and a human developing brain reference atlas27. UMAPs show screen condition groups (left, using morphogens SAG (sonic hedgehog signaling agonist), CHIR, BMP and FGF) and regional annotation of screen data (right). b, Comparison of regional annotation of screen data (rows) and scArches-transferred regional labels from the primary reference. c, Proportions of cells assigned to different regions on the basis of reference projection. Every stacked bar represents one screen condition. d, Clustering of HNOCA datasets with conditions in the screen data on the basis of average presence scores of clusters in the primary reference. The heatmap shows average presence scores per cluster in the primary reference (columns). e, UMAP of primary reference coloured by the dissected regions (right) and the maximum presence scores across the screen conditions (left). f, Gain of cell cluster coverage of screen conditions relative to HNOCA datasets, with negative values trimmed to zero. The grey horizontal line shows the threshold (0.3) to define gained clusters in screen data. g, UMAP of the primary reference, with gained clusters highlighted in shades of blue. Dashed circles highlight two clusters with highest gain of coverage in telencephalon and midbrain, respectively. h, Coexpression scores of cluster marker genes of the two clusters highlighted in g, in the primary reference (upper) and screen dataset (lower). DA, dopaminergic.

