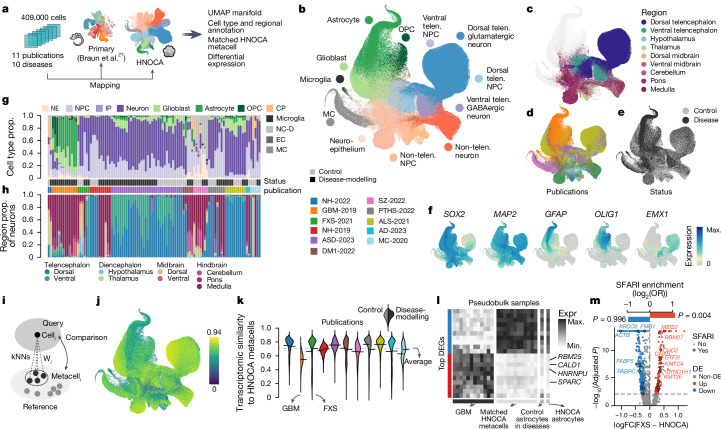
Fig. 5. The HNOCA as a control cohort to facilitate cell type annotation and transcriptomic comparison for neural organoid disease-modelling data.
a, Overview of disease-modelling neural organoid atlas construction, and projection to primary atlas27 and HNOCA for downstream analysis. b–f, UMAP of integrated disease-modelling neural organoid atlas coloured by predicted cell type annotation (b), predicted regional identities of NPCs, intermediate progenitor cells and neurons (c), publications (d), disease status (e) and marker gene expression (f). g,h, Proportions (prop.) of cells assigned to different cell classes (g) and regions (h). Every stacked bar represents one biological sample. Side bars show disease status and publication. i, Schematic of reconstructing matched HNOCA metacell for each cell in the disease-modelling neural organoid atlas. j, UMAP of disease-modelling neural organoid atlas, coloured by transcriptomic similarity with the matched HNOCA metacells. k, Violin plot indicates distribution of estimated transcriptomic similarities, split by publication. Left, distribution in control cells and right, distribution in disease cells. l, Heatmap showing expression of top DEGs between the AQP4+ population in the GBM-2019 dataset and their matched HNOCA metacells. Rows show DEGs with the ten strongest decreased and increased expressions. Columns show average expression in the AQP4+ population of disease-modelling samples (first panel), the matched HNOCA metacells per sample (second panel), all predicted control astrocytes and all astrocytes in HNOCA. m, Volcano plot shows DE analysis between dorsal telencephalic cells in the FXS-2021 dataset and their matched HNOCA metacells. DEGs coloured in red (increased in FXS) and blue (decreased in FXS). Encircled dots show DEGs annotated in SFARI database. Top bars show the log-transformed odds ratio of SFARI gene enrichment in the increased (red) and decreased (blue) DEGs. GBM, glioblastoma.

