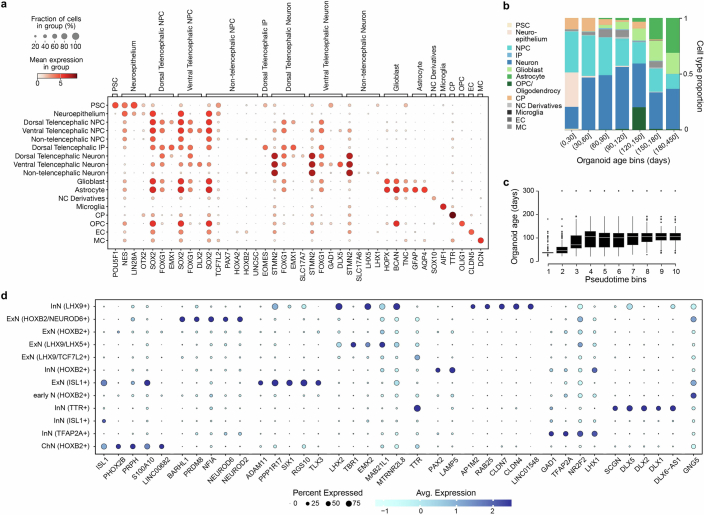
Extended Data Fig. 2. Characterization of HNOCA.
(a) Expression of selected marker genes used in the semi-automatic annotation of cell types for Fig. 1. (b) Mean cell type proportion over all data sets per organoid age bin. (c) Distribution of sample real-time age in days over deciles of computed pseudotime. (d) Expression of top markers in different non-telencephalic neural cell types. Markers are defined as genes with AUC > 0.7, in-out detection rate difference>20%, in-out detection rate ratio>2 and fold change>1.2. When more than 5 markers are found, only the top-5 (with the highest in-out detection rate ratio) are shown.

