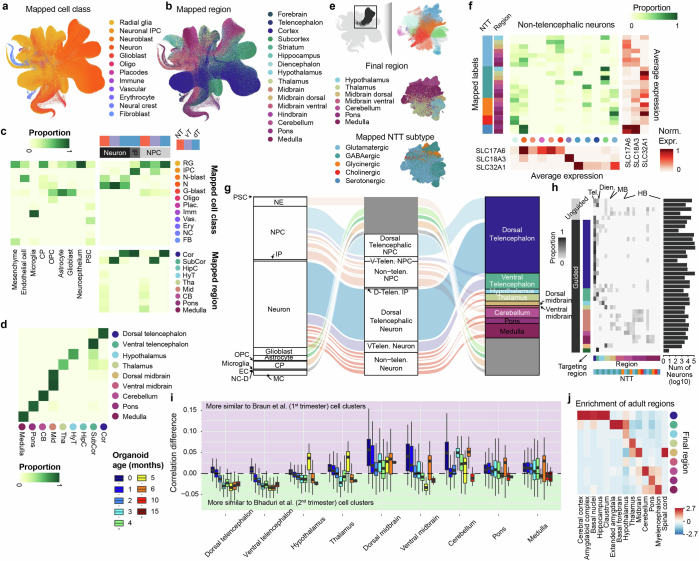
Extended Data Fig. 3. Mapping-assisted annotation refinement of HNOCA.
(a-b) UMAP of HNOCA colored by the mapped (a) cell classes and (b) brain regions, both from the human developing brain cell atlas as the primary reference. (c) Comparison of the HNOCA cell type annotation with the primary reference mapping-based transferred cell class and brain region labels. Darkness of cells indicates proportions of each HNOCA cell type being assigned to different cell class and brain region categories. Brain region labels are only shown for the HNOCA neural cell types. (d) Comparison of the simple majority-voting-based regional label transfer and the hierarchical regional label transfer with random-walk-with-restart-based smoothening. Only cells annotated as NPCs, IPs and neurons are included. (e) UMAP of non-telencephalic neurons, colored by clusters (upper), mapped brain regions (middle) and mapped neurotransmitter transporter (NTT) subtypes (bottom). (f) Comparison of non-telencephalic neural cell types, defined as the concatenation of the mapped brain region and NTT subtype, with the clusters. The middle heatmap shows contributions of different clusters to different neural cell types. The sidebar on the left shows the neural cell types; dots under the heatmap show clusters. The heatmaps on the bottom and on the right show the average expression of three neurotransmitter transporters SLC17A6, SLC18A3 and SLC32A1 in clusters (bottom) and neural cell types (right). (g) Overview of the HNOCA cell type composition for the first two levels of the cell annotation (left - level-1, middle - level-2), and the refined regional annotation assisted by mapping of non-telencephalic NPC and neurons to the primary reference (right). (h) neural cell type compositions of different data sets (rows). Darkness of the heatmap shows the proportions of different neural cell types per HNOCA data set. Sidebars on the left show organoid protocol types of different data sets. Sidebars on the bottom show neural cell types. Bars on the right show total neuron numbers across data sets. (i) Distribution of transcriptomic similarity differences of NPCs and neurons in HNOCA with the primary neuronal populations in the first trimester (represented by Braun et al.27) and the second trimester (represented by Bhaduri et al.29). Cells are firstly grouped by regional identities, followed by organoid ages (in months). Colors of boxes indicate organoid ages. (j) Heatmap shows the enrichment of adult regional identities (columns) for HNOCA NPCs and neurons with different estimated regional identities (rows).

