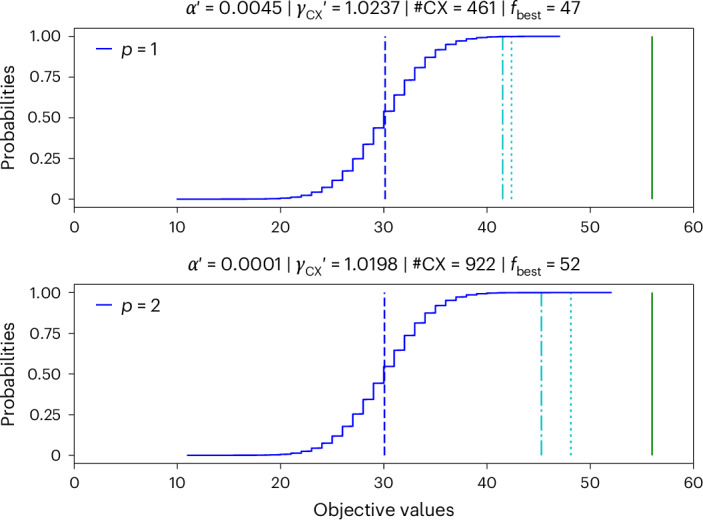
Fig. 3. QAOA results for 40 qubits.

The curve is the cumulative distribution function resulting from sampling the circuits for a MaxCut instance executed on ibm_sherbrooke for p = 1 with 105 shots (top) and p = 2 with 107 shots (bottom), both applying M3 measurement error mitigation. The vertical lines show the corresponding noisy expectation values (blue dashed), the noise-free expectation values evaluated using light-cone optimized classical simulation (cyan dashed–dotted), the (cyan dotted) and the globally optimal solution equal to 56 (green solid). The title shows the fitted αp′ and corresponding γCX′ (cf. main text) such that the are equal to the noise-free expectation values (that is, cyan dashed–dotted line). Further, the titles show the number of CNOT gates (#CX) and the best sampled objective value (fbest) for p = 1, 2.
