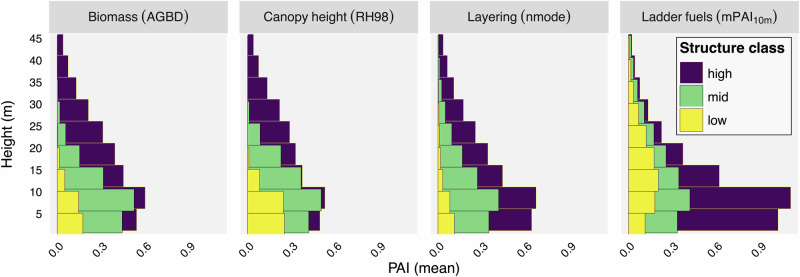
Fig. 2. Vertical profiles for four GEDI-derived fuel structure metrics, each split into three structural classes.
Horizontal bars represent the mean plant area index (PAI) in 5 m vertical height bins from 0–45 m for all GEDI footprints in the study domain. The three structure classes represent percentiles – <33% (low), 33–67% (mid), and >67% (high) – for each structural metric, and depict how characteristic vertical PAI distributions differ among forests possessing low to high structural attributes for each metric, respectively. See Table 1 for description of metrics.

