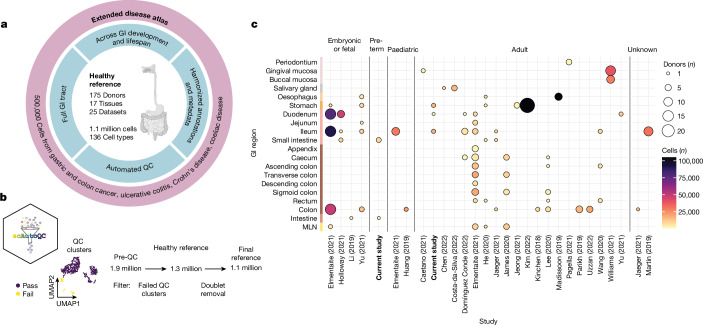
Fig. 1. Overview of pan-gastrointestinal cell integration.
a, Schematic overview of the atlas denoting the healthy reference as a core, with additional disease datasets mapped by transfer learning. GI, gastrointestinal; QC, quality control. Schematic in panel a was created with BioRender (https://biorender.com). b, Overview of scAutoQC, an automated, unsupervised quality control approach to remove low-quality cells. UMAP, uniform manifold approximation and projection. c, Overview of the number of cells and donors per study, broken down by age and region of the gastrointestinal tract (y axis). The dot size indicates the number of donors, and the colour indicates the number of cells. The colours of the y axis indicate broad-level organs (oral mucosa, salivary gland, oesophagus, stomach, small intestine, large intestine and mesenteric lymph node (MLN)). Caetano (2021), ref. 50; Chen (2022); ref. 51; Costa-da-Silva (2022), ref. 52; Domínguez Conde (2022), ref. 53; Elmentaite (2021), ref. 5; He (2020), ref. 54; Holloway (2021), ref. 55; Huang (2019), ref. 56; Jaeger (2021), ref. 57; James (2020), ref. 58; Jeong (2021), ref. 59; Kim (2022), ref. 60; Kinchen (2018), ref. 9; Lee (2020), ref. 61; Li (2019), ref. 62; Madissoon (2019), ref. 63; Martin (2019), ref. 6; Pagella (2021), ref. 64; Parikh (2019), ref. 23; Uzzan (2022), ref. 65; Wang (2020), ref. 66; Williams (2021), ref. 19; Yu (2021), ref. 67.

