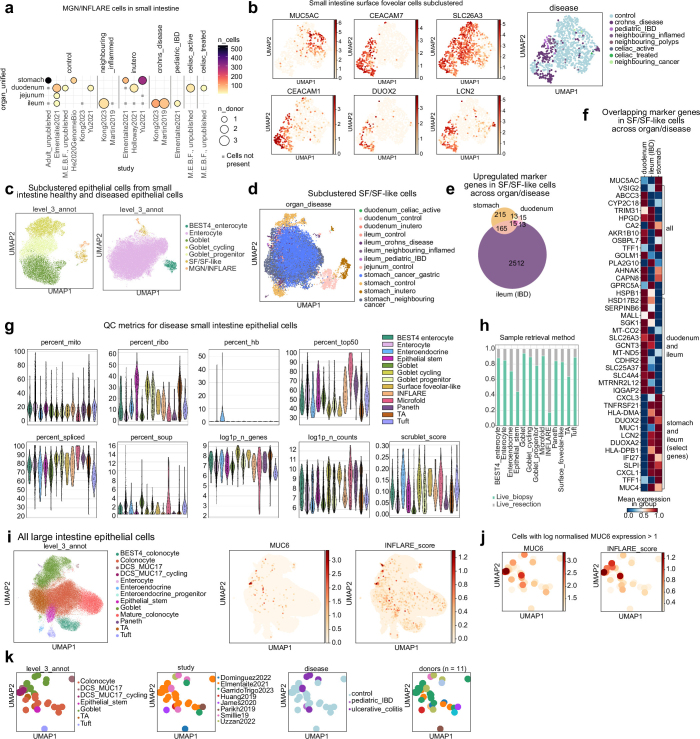
Extended Data Fig. 6. Identification of INFLAREs.
a) Overview of the number of MGN (Mucous gland neck)/INFLAREs (Inflammatory Epithelial cells) and donors per study, broken down by age and region of the GI. Dot size indicates the number of donors, colour indicates the number of cells. b) UMAP of subclustered surface foveolar (SF) cells from small intestine, showing heterogeneity of marker genes and additional genes upregulated in disease cells annotated as SF cells (SF-like cells). c) UMAP of subclustered INFLAREs, SF/SF-like cells and either goblet or enterocyte populations, showing distinct separation of populations highlighting transcriptional differences. d) UMAP of subclustered SF and SF-like cells across the atlas, coloured by age, region and disease status. e) Overlap of SF/SF-like marker genes from different regions. Marker genes of SF/SF-like cells were calculated by differential gene expression (wilcoxon rank-sum test) of other stomach and small intestine epithelial cells separately for healthy adult stomach SF cells, healthy adult duodenum SF cells and ileum CD SF-like cells showing overlapping marker genes. f) Heatmap of overlapping marker genes calculated in (e) (with MUC5AC for reference) showing overlapping genes across all comparisons, healthy duodenum and CD ileum, and selected genes of the 165 overlapping in healthy stomach and CD ileum. g) Violin plot for QC metrics across epithelial cell subsets from diseased samples (mito = mitochondria, ribo = ribosomal, hb = haemoglobin). h) Stacked barplot for sample retrieval method for cells in disease small intestinal samples, highlighting that the majority of INFLAREs come from resections rather than biopsies. i) UMAP of epithelial cells from large intestine, with added data from studies8,100 (totalling an additional 209,347 cells from 23 control, 24 CD and 23 UC patients) coloured by cell type, MUC6 gene expression and gene score for INFLARE markers (MUC6, BPIFB1, AQP5, PGC). j) Cells from (i) filtered by log-normalised MUC6 expression greater than 1, coloured by MUC6 gene expression and INFLARE marker score. k) Cells from (j) coloured by cell type, study, disease and donor.

