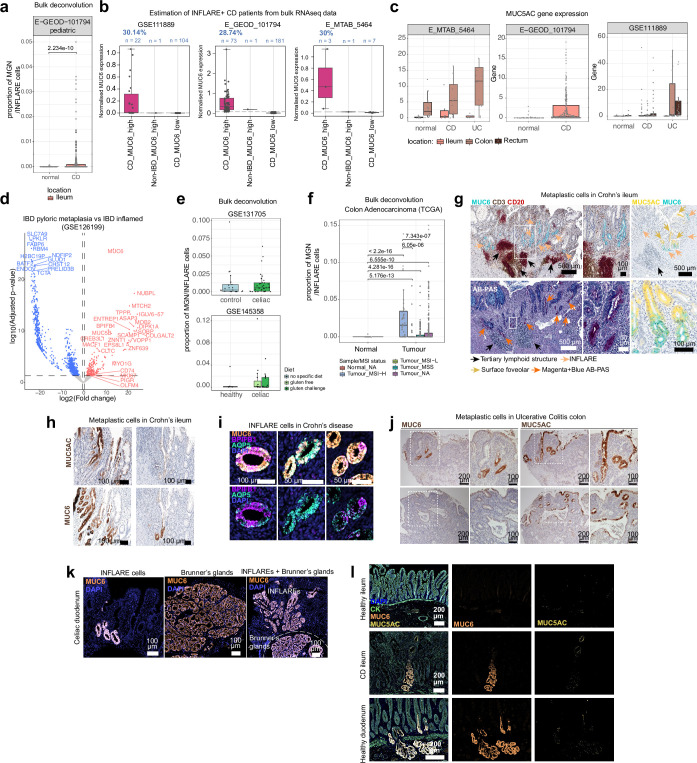
Extended Data Fig. 7. Validation of INFLAREs.
a) Deconvolution (BayesPrism) of bulk RNAseq dataset comparing MGN and INFLAREs in healthy (normal, n = 50) and CD (n = 254). Statistical analysis was performed using two-sided Wilcoxon rank-sum test. b) Estimation of CD patients with INFLAREs based on stratification of high and low MUC6 expressing samples from the bulk datasets indicated, showing ~29% of patients have high MUC6 expression. c) Expression of MUC5AC from bulk datasets indicated comparing expression in controls, CD and UC patients. d) Differential gene expression analysis (DESeq2) from laser capture microdissected epithelium from healthy crypts (n = 7), inflamed crypts from IBD patients (n = 6) and metaplastic glands from IBD patients (n = 6) from published data (GSE126199). Genes with a log2FC greater than 0 are upregulated in metaplastic glands compared to inflamed IBD epithelium, based on two-sided Wald test with Benjamini and Hochberg correction. e) Deconvolution (BayesPrism) of bulk RNAseq from celiac disease comparing MGN and INFLARE proportions in healthy and celiac disease tissue. For GSE131705, n = 21 (healthy) and n = 33 (celiac). For GSE145358, n = 6 (healthy), n = 15 (celiac gluten free) and n = 15 (celiac gluten challenge). f) Deconvolution (BayesPrism) of TCGA bulk RNAseq data of MGN and INFLAREs in healthy tissue (normal, n = 41) and tumour tissue stratified by microinstability status, n = 40 (Tumour_MSI-H), n = 42 (Tumour_MSI-L), n = 126 (Tumour_MSS) and n = 272 (Tumour_NA). MSI-high tumours are predicted to have higher levels of INFLAREs. Statistical analysis was performed using two-sided Wilcoxon rank-sum test. For all box and whisker plots the lower edge, upper edge and centre of the box represent the 25th (Q1) percentile, 75th (Q3) percentile and the median, respectively. The interquartile range (IQR) is Q3 - Q1. Outliers are values beyond the whiskers (upper, Q3 + 1.5 x IQR; lower, Q1 − 1.5 x IQR). g) Protein and ABPAS (Alcian Blue Periodic acid-Schiff) staining of INFLAREs (MUC6, Magenta+Blue+ ABPAS staining) and metaplastic surface foveolar cells (MUC5AC) in CD ileum showing association with tertiary lymphoid structures (dense nuclei and CD3/CD20+ regions). Selected regions adjacent to lymphoid structures from n = 2 (CD3, CD20, MUC6 staining), n = 2 (AB-PAS staining) and n = 2 (MUC5AC, MUC6 staining). h) Protein staining of INFLAREs (MUC6) and metaplastic surface foveolar cells (MUC5AC) from CD ileum tissue from additional donors (n = 3). i) smFISH staining of INFLARE (Inflammatory Epithelial cell) markers (MUC6, AQP5 and BPIFB1) in pyloric metaplasia of CD duodenum showing heterogeneity in AQP5 and BPIFB1 expression (n = 4). j) Protein staining of INFLAREs (MUC6) and metaplastic surface foveolar cells (MUC5AC) in colon resection tissue from UC patients (n = 3). Upper and lower panels are images from two different patients. k) Protein staining of MGN and INFLAREs (MUC6) in celiac disease duodenum showing INFLAREs and healthy MGN cells in Brunner’s gland in the submucosa (n = 2). l) Protein staining of MUC6, MUC5AC and cytokeratin (CK) in healthy ileum (n = 4), CD ileum (n = 4) and healthy duodenum (n = 2). All images show representative staining from the replicates indicated.

