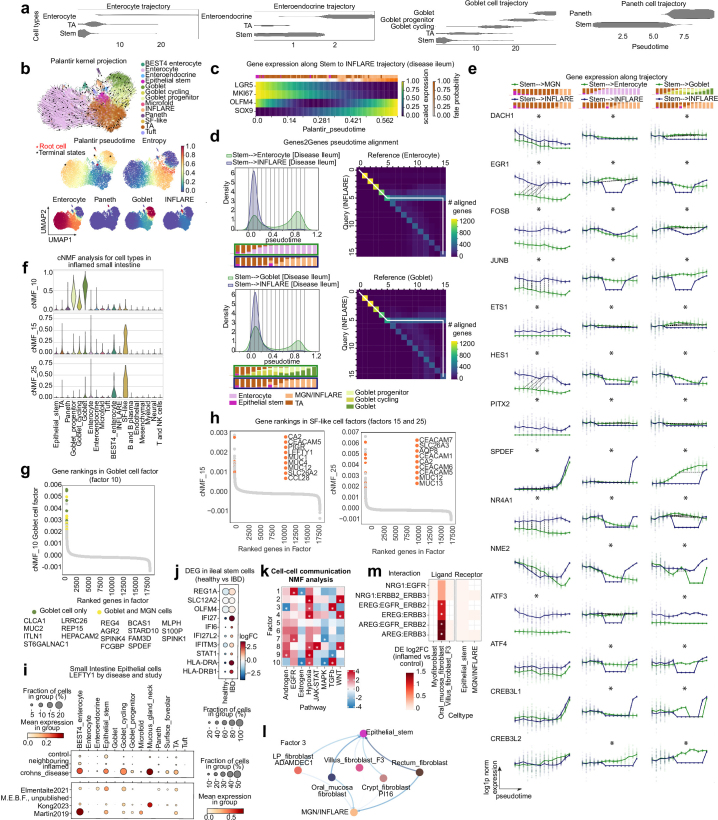
Extended Data Fig. 8. Origins and stem-like features of INFLAREs.
a) Relative cell proportions along healthy trajectories as calculated by Monocle3, to give confidence in the reconstruction of known trajectories. b) Palantir trajectory analysis from remapped studies, showing CellRank kernel projection and pseudotime of 4 terminal cell states in inflamed ileum. c) Scaled expression of stem markers as in Fig. 4b in the Palantir pseudotime trajectory for INFLAREs. d) Genes2Genes alignment of Palantir pseudotime trajectories for stem → INFLARE compared with stem → enterocyte and stem → goblet in inflamed ileum. Left: Cell density plots of the aligned trajectories along pseudotime, marked with 15 interpolation time points (bins) used for each alignment, and the corresponding cell-type proportions of those bins as stacked bar plots for each comparison. Right: Overall average alignment paths (highlighted in white) of the 1262 transcription factors between the interpolation pseudotime points along the trajectories for both comparisons. Each matrix cell of the pairwise heatmap gives the number of TFs where the corresponding pseudotime points have been matched. e) Mismatched genes (alignment similarity ≤ 50% and optimal alignment cost ≥ 30 nits) in INFLARE compared to control trajectories as indicated, showing their pseudotime alignments in (d) and Fig. 4d using Genes2Genes. Bold lines represent mean expression trends and faded data points are 50 random samples from the estimated expression distribution at each time point. The black dashed lines visualise matches between time points. Asterix indicates significant mismatch in gene alignment (as outlined above) for the specific gene/trajectory comparison. f) cNMF analysis (Methods) of cell types from IBD small intestine in the atlas. Violin plots showing expression of ranked genes in factors related to SF-like cells and goblet cells. g) Gene rankings of genes in factor 10 (goblet cell factor) with goblet cell specific genes highlighted in green and those also expressed in Mucous gland cells (MGN and INFLARE and SF-like cells) highlighted in yellow. h) Gene rankings of genes in factors 15 and 25 (SF-like cell factors) with select genes highlighted. i) Dotplot of LEFTY1 expression in small intestine epithelial cells across cell types and conditions (upper) and across cell types and study (lower). j) Dot plot of selected differential expressed genes (wilcoxon rank-sum test) in epithelial stem cells (LGR5+) from the ileum of patients with IBD compared with healthy controls. k) NMF factors from cell-cell communication analysis using ligand/receptor mean expression and cell type pairs to determine factors. Heatplot shows the expression of ligand/receptor pairs categorised into pathways for each factor. l) Connectivity of high ranking cell types in factor 3, showing interactions between fibroblasts (sources) and epithelial stem cells or INFLAREs (targets). Line thickness indicates a higher number of ligand/receptor pairs per cell type pairing. m) Expression (log2FC from DESeq2) comparing ligand and receptor expression in healthy controls vs IBD samples in relevant cell types from (l) for ligands and receptors within the NRG1/AREG/EREG pathway. Positive log2FC indicates upregulation of ligand/receptor expression in IBD compared to healthy controls.

