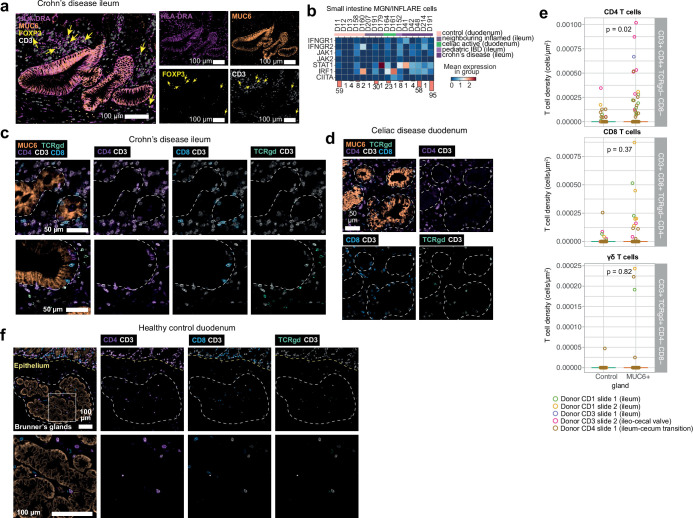
Extended Data Fig. 10. INFLARE:T cell interactions.
a) Protein expression in CD ileum (representative of n = 2) of HLA-DR (MHC-II) in INFLAREs (MUC6) along with localisation of CD3+ T cells and regulatory T cells (FoxP3+CD3+). b) Expression per donor of genes involved in IFNGR to MHC-II signalling pathway in INFLAREs and MGN cells in small intestine, as summarised in Fig. 5f. c) Additional protein staining for INFLAREs (MUC6) in CD disease ileum (as in Fig. 5g, n = 4) with various T cell subsets (CD4+CD3+, CD8+CD3+, TCRγδ+CD3+T cells). d) Protein staining as in (c) in Celiac disease duodenum tissue (n = 2). e) Quantitation of T cell densities for the T cell subsets indicated in MUC6+ glands and adjacent control epithelium across 5 sections from 3 donors as represented in (c). P-values calculated based on ROIs as replicates (n = 126 MUC6+ ROIs and 59 adjacent control ROIs) using negative binomial linear regression, adjusting for log area, two-sided Wald test. f) Protein staining as in (c) and (d) in healthy proximal duodenum (n = 2) showing abundance and localisation of T cell subsets in Brunner’s glands.

