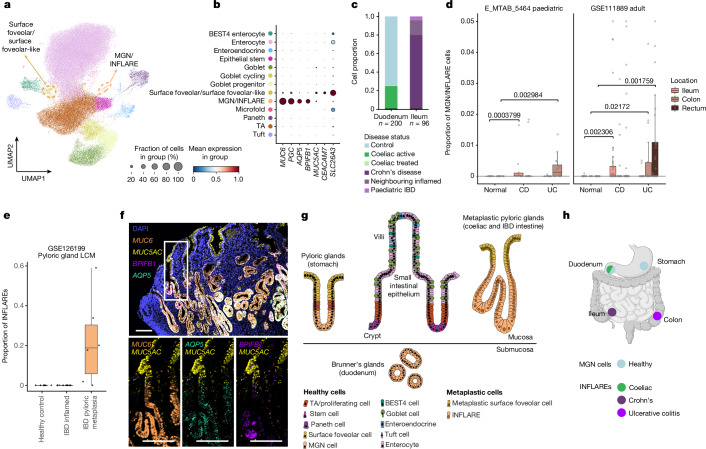
Fig. 3. Identification of INFLAREs resembling pyloric or Brunner’s gland neck cells in health.
a, UMAP showing cells from the small intestinal epithelium in the full atlas (healthy and diseased). MGN or INFLARE and surface foveolar cells, both involved in pyloric metaplasia, are highlighted with a dashed circle. b, Marker gene dotplot of pyloric gland cell markers (MGN and surface foveolar cells). The cell type legend is shared in a and b. c, Proportion of MGN or INFLAREs by disease category in the duodenum and ileum. d, Bulk deconvolution (BayesPrism) using disease intestinal epithelium as a reference in studies of Crohn’s disease (CD) and ulcerative colitis (UC). For E_MTAB_5464, n = 25 (CD), 27 (UC) and 27 (normal). For GSE111889, n = 122 (CD), 71 (UC) and 50 (normal). Numbers above brackets represent P values calculated by two-sided Wilcoxon rank-sum test. e, Bulk deconvolution as in d from the laser capture microdissection (LCM) epithelium from healthy crypts (n = 7), inflamed crypts from patients with IBD (n = 6) and metaplastic glands from patients with IBD (n = 6). For both d and e, the lower edge, upper edge and centre of the box represent the 25th (Q1) percentile, 75th (Q3) percentile and the median, respectively. The interquartile range (IQR) is Q3 − Q1. Outliers are values beyond the whiskers (upper, Q3 + 1.5 × IQR; lower, Q1 − 1.5 × IQR). f, smFISH staining of MGN and INFLARE cell marker genes (MUC6, AQP5 and BPIFB1) and surface foveolar cell markers (MUC5AC) in a biopsy from the duodenum from a patient with Crohn’s disease and pyloric metaplasia. Representative images from n = 4. Scale bars, 100 µm. g, Organization of cells within the gastric glands in the stomach, small intestinal epithelium, Brunner’s glands and metaplastic pyloric glands. h, Schematic of MGN and INFLARE cell distribution across the stomach and intestines, defining MGN cells in the healthy stomach and duodenum and INFLAREs in the coeliac duodenum, Crohn’s disease ileum and ulcerative colitis colon. The schematic in panel h was created with BioRender (https://biorender.com).

