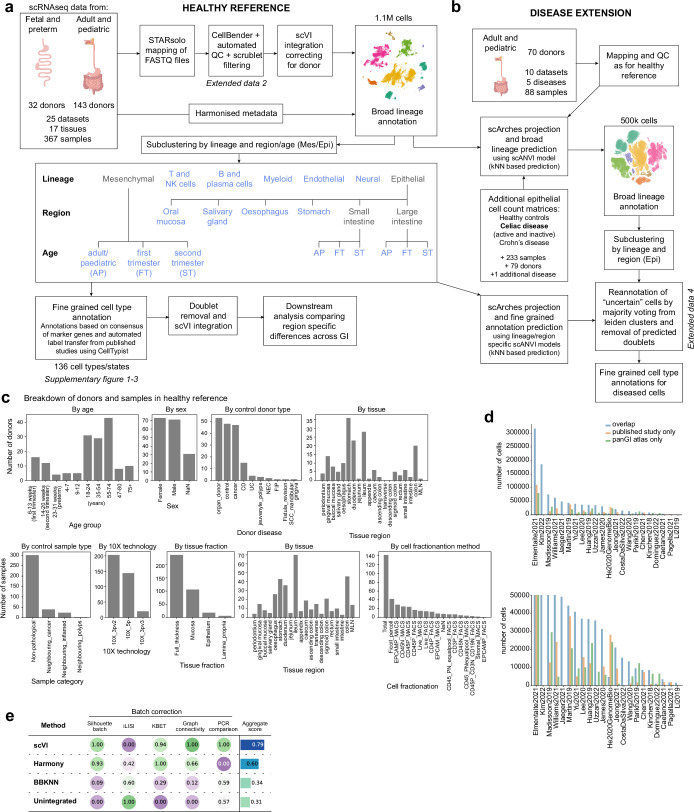
Extended Data Fig. 1. Overview of atlas assembly.
a) Detailed flowchart of the methods used to assemble the healthy reference, datasets were remapped and filtered based on scAutoQC automated QC pipeline (Supplementary Fig. 2), integrated with scVI and annotated as broad lineages. Broad lineages were subclustered, and lineages with high level of heterogeneity (Epithelial and Mesenchymal lineages) were further subclustered based on age and/or region to accurately annotate at a fine-grained level. Cells in these subclustered views of the healthy reference were annotated by a semi-automated approach, taking into account the marker genes and CellTypist predictions from published studies. Schematic in panel a was created with BioRender (https://biorender.com). b) The healthy reference was used as an anchor to project disease datasets onto the atlas using scArches, fine-grained annotations were generated in a two-step approach, first with broad lineage prediction using scANVI and subclustering by lineage/region as with the healthy reference to predict the fine-grained annotations. Most disease data was remapped and QC’ed as with the healthy reference, except two additional studies from CD (Kong, 2023) and celiac disease (M.E.B.F., unpublished) which were added to the atlas from the published count matrices. c) Breakdown of the distribution of donors and samples in the healthy reference based on various metadata as specified. d) Overlapping and unique cells in our pan-GI atlas and the published studies (based on available count matrices). e) Benchmarking of batch correction across 3 integration methods for the healthy reference atlas versus the unintegrated atlas.

