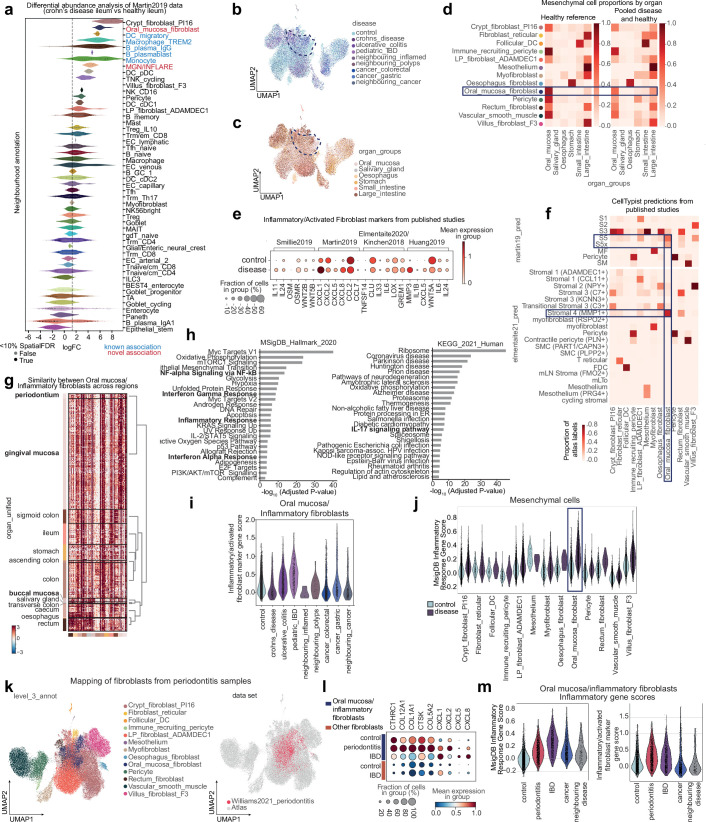
Extended Data Fig. 4. Inflammatory fibroblasts in disease share transcriptional similarity to homeostatic fibroblast population in the oral mucosa.
a) Differential abundance analysis of cell neighbourhoods from Martin et al. (2019)6 dataset based on embedding on the whole atlas84. Cell neighbourhoods with positive log fold change are enriched in CD compared to healthy samples. b) UMAP of mesenchymal cells from adult/pediatric samples in health and disease, shown by disease category. Dashed line highlights the oral mucosa fibroblast cluster. c) UMAP of mesenchymal cells from adult/pediatric samples in health and disease, shown by organ. Dashed line highlights the oral mucosa fibroblast cluster. d) Proportion of mesenchymal cell types/states by organ in the healthy reference and combined healthy and disease. Oral mucosa fibroblasts appear in other organs in disease. e) Markers of inflammatory and activated fibroblasts from published studies99 showing expression in oral mucosa/inflammatory fibroblasts from controls (oral mucosa fibroblasts) and disease (inflammatory fibroblasts) samples. f) CellTypist predictions of cell annotations in mesenchymal populations from published studies5,6 showing oral mucosa fibroblasts predicted to be inflammatory/activated fibroblast populations in both studies. g) Differential gene expression and hierarchical clustering of oral mucosa/Inflammatory fibroblasts from different regions. Oral mucosa fibroblasts from gingival mucosa and periodontium are most distinct from fibroblasts in other organs. h) Gene set enrichment analysis showing pathways (including various inflammatory pathways) enriched in inflammatory fibroblasts (disease) compared to oral mucosa fibroblasts (healthy). The adjusted p-values have been calculated using wilcoxon rank-sum test. i) Gene score for inflammatory/activated fibroblasts markers in (d) expressed in oral mucosa/inflammatory fibroblasts across disease conditions. j) MSigDB inflammatory response gene score (significantly enriched in inflammatory vs oral mucosa fibroblasts), across all mesenchymal cell types/states in control and disease samples. k) UMAP of mesenchymal populations from the atlas with the addition of fibroblasts from periodontitis data19 mapped onto the atlas using scArches and scANVI, coloured by level 3 annotation and highlighting the added data. LP = lamina propria. l) Dotplot showing expression of oral mucosa marker genes and inflammatory chemokines in oral mucosa/inflammatory fibroblasts in healthy tissue, periodontitis and IBD. Expression in other fibroblasts (combined population including crypt_fibroblast_PI16, LP_fibroblast_ADAMDEC1, oesophagus fibroblast, rectum fibroblast and villus_fibroblast_F3) from control and IBD shown for comparison. m) Inflammatory gene scoring in oral mucosa/inflammatory fibroblasts across disease conditions, as in Fig. 2e and Extended Data Fig. 4i,j.

