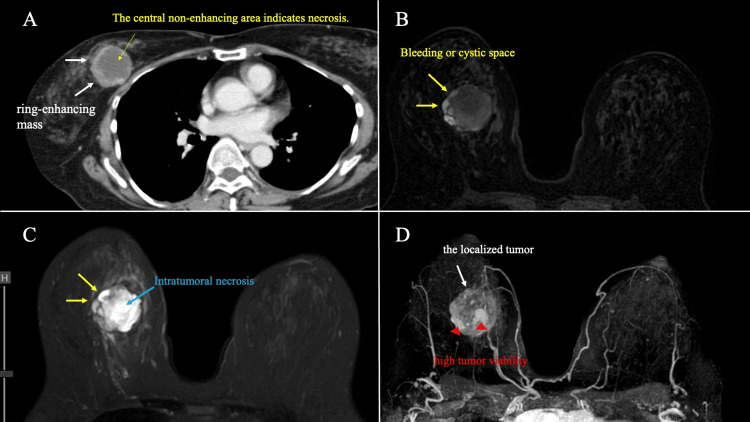
Figure 2. Contrast-enhanced CT and MRI findings.
(A) CT showed a ring-enhancing mass (white arrow). (B, C) The tumor margins exhibited elevated SI on both T1WI and T2WI in MRI (yellow arrow). The yellow arrows indicating internal bleeding or cystic regions. (D) MIP images show the localized tumor (white arrow) with no obvious intraductal spread. Tumor showed areas of high proliferative potential (red arrowheads).
CT: Computed tomography, MRI: Magnetic resonance imaging, SI: signal intensity, WI: weighted images, MIP: Maximum intensity projection.

