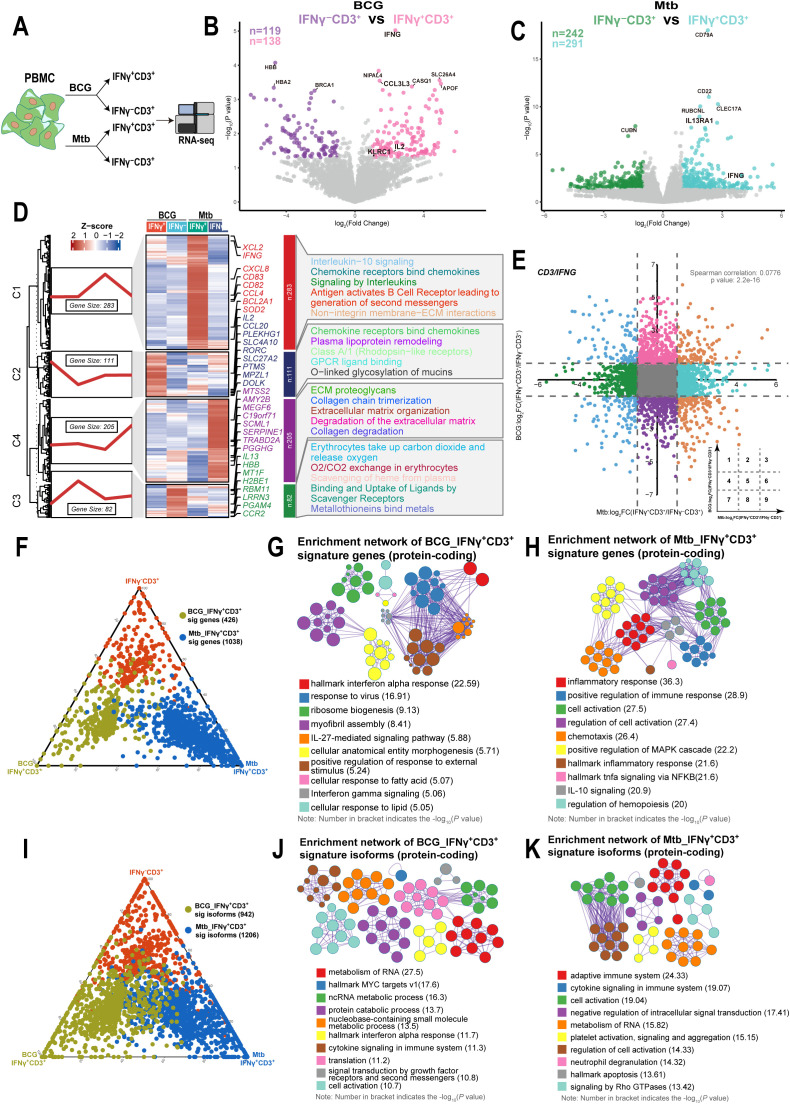
Figure 2.
IFNγ+CD3+ cells induced by BCG showed different gene expression patterns with those induced by Mtb. (A) Schematic of isolated IFNγ+CD3+, IFNγ-CD3+ cells experimental design. Fresh PBMC were stimulated with BCG or Mtb for 6 hours. The cells were then subjected to phenotypic analysis and RNA-seq. (B) Volcano plot comparing IFNγ+CD3+ (pink) to IFNγ-CD3+ (purple) treated with BCG. The expression of 138 genes was significantly higher in IFNγ+CD3+ T cells, and that of 119 genes was significantly higher in IFNγ-CD3+ T cells. (C) Volcano plot comparing IFNγ+CD3+ (light blue) and IFNγ-CD3+ (green) cells treated with H37Rv. The expression of 291 genes was significantly higher in IFNγ+CD3+ T cells, and that of 242 genes was significantly higher in IFNγ-CD3+ T cells. (D) Gene expression patterns analysis. Left: 681 DEGs between IFNγ+CD3+ and IFNγ-CD3+ cells stimulated by BCG or Mtb categorized into four clusters based on their characteristic expression patterns. Middle: Heatmap showing the expression patterns of key dynamically expressed genes (681 genes). Right: Reactome pathways enriched in each gene cluster were identified. (E) The nine-quadrant diagram displays the expression patterns of genes across subgroups. All genes with |log2FC|≥1.0 are marked. In quadrant 1, genes are upregulated in BCG but downregulated in Mtb. Quadrant 9 shows genes upregulated in Mtb but downregulated in BCG. Quadrant 3 includes genes upregulated in both BCG and Mtb, while quadrant 7 shows genes downregulated in both. No significant correlations were found in quadrants 2, 4, 5, 6, and 8. (F, I) The ternary phase diagrams illustrate the relative enrichment of IFNγ+CD3+ T cells exposed to BCG or Mtb, focusing on signature genes (F) and protein-coding isoforms (I). Signature isoforms were identified as those showing differences at the isoform level but not at the gene level. (G, H) The enrichment networks display the top 10 enriched terms for IFNγ+CD3+ T cells exposed to BCG (G) or Mtb (H) based on signature genes. (J, K) Similarly, enrichment networks represent the top 10 enriched terms for IFNγ+CD3+ T cells exposed to BCG (J) or Mtb (K) based on protein-coding signature isoforms. Enriched terms with high similarity were grouped into clusters and visualized as a network. Each node represents an enriched term, color-coded by its cluster. Node size corresponds to the number of enriched genes, and line thickness reflects the similarity score between terms. The term with the lowest P value in each cluster is labeled.

