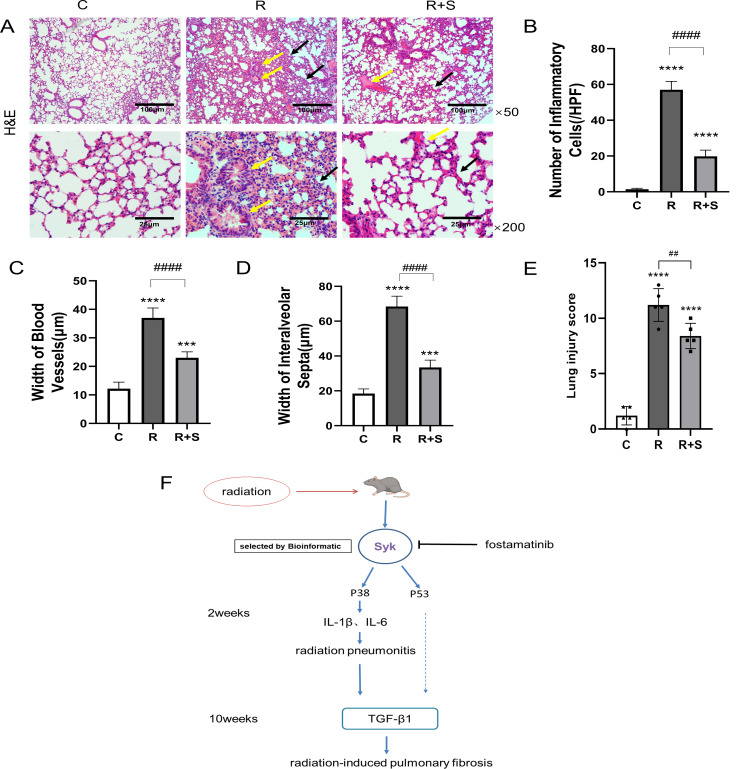
Figure 3.
Pathological changes of the lung at 2 weeks after radiation. (A) Photomicrographs show the H&E staining of lung tissues of mice in different groups at ×50 and ×200 magnification. Scale bar, 100 μm for ×50 and 25 μm for ×200. (B–D) The number of inflammatory cells per high-power field of vision, width of blood vessels, and width of interalveolar septa were determined from five random fields in high magnification in lung tissue (n = 5 for each group). (E) H&E staining area from five random fields in high magnification was analyzed, and Smith scale was used to evaluate the degree of lung injury (n = 5 for each group). (F) Diagram of the hypothetical mechanism by which Syk and its inhibition regulate radiation-related lung injury. *** P < 0.0005, **** P < 0.00005 vs. C group, ## P < 0.005, #### P < 0.00005. HPF, high-power field.

