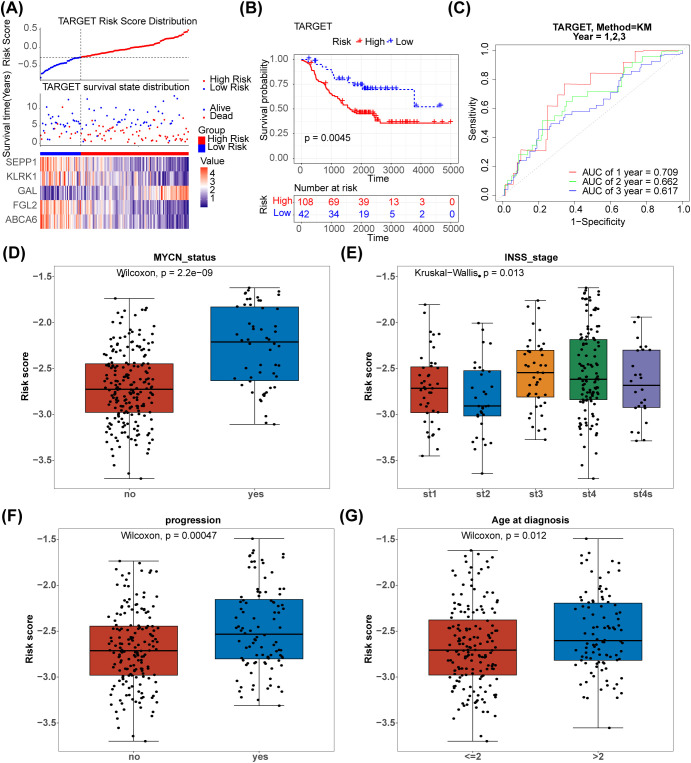
Figure 4.
Validation of the NETs -based signature in the testing set.(A) Distribution of TARGET prognostic index in high risk group (n = 108) and low risk group (n = 42), survival status of patients in high risk group (n = 108) and low risk group (n = 42) and the heatmap of prognostic gene. (B) The Kaplan-Meier curves showed that significant differences were identified for OS between high risk group (n = 108) and low risk group (n = 42). (C) ROC curves evaluating the sensitivity and specificity of the NETs-based prognostic model(TARGET). (D–G) The association between clinical traits and risk score of NB.

