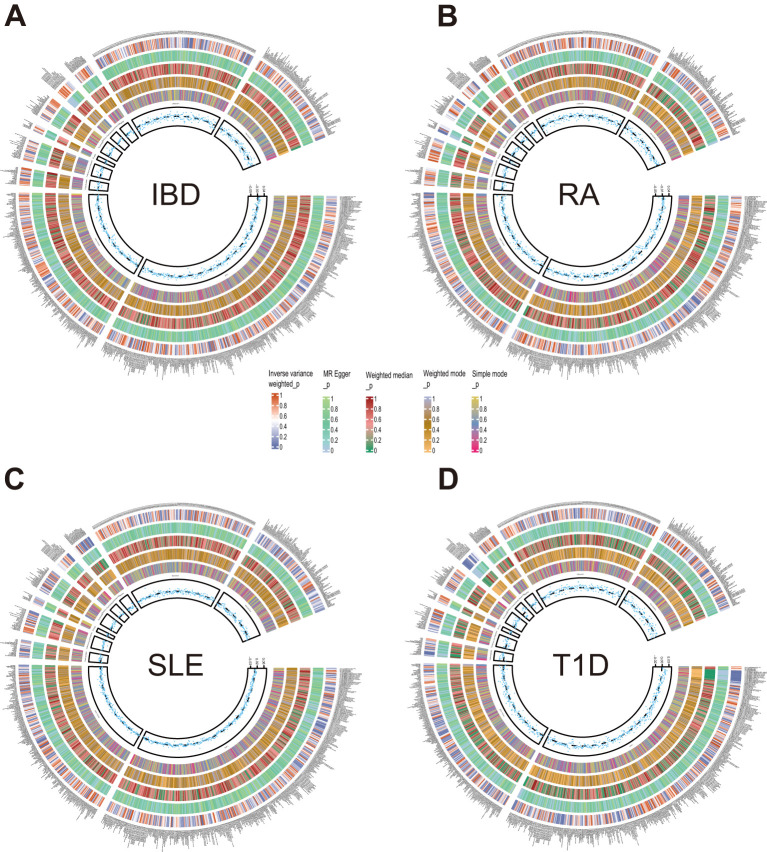
Figure 4.
Circle diagrams of the discovery sample in the reverse MR analysis. The complete results of the reverse MR analysis, showing the causal effects of ADs on plasma metabolites. (A) IBD, (B) RA, (C) SLE, (D) T1D. Five statistical methods, respectively, IVW, MR Egger, Weighted median, Weighted mode, and Simple mode, are represented by five circles from inner to outer.

