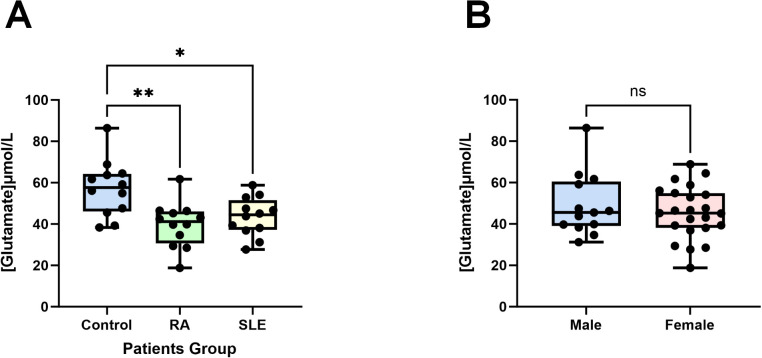
Figure 9.
Glutamate concentrations in patients’ plasma. (A) Compared to the control group (healthy individuals, n = 12), the plasma glutamate concentrations in patients with RA (n = 12) and SLE (n = 12) were significantly reduced. (B) There are no differences in male (n = 13) and female (n = 23) plasma glutamate concentrations. Data are presented as the mean ± SD; ns: not significant, *P < 0.05, **P < 0.01.

