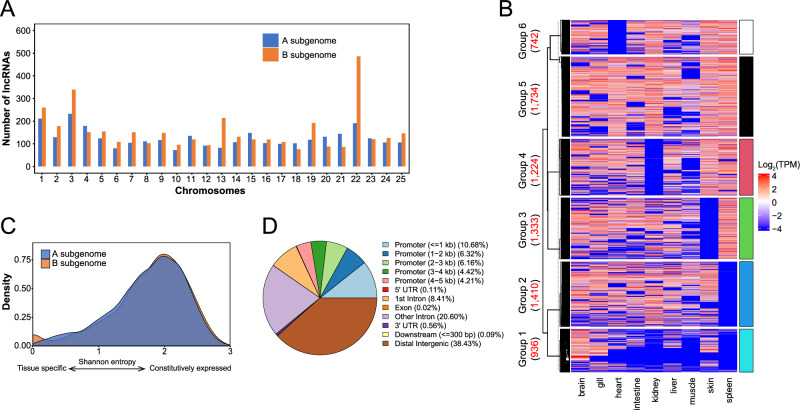
Fig. 3. Expression and functions of lncRNAs in common carp.
A The B subgenome harbored a greater number of lncRNAs than the A subgenome. B Heatmap of expression level showing the tissue-specificity of lncRNAs. The numbers within parentheses indicate the number of lncRNAs in each group. C LncRNAs originating from the A and B subgenomes showed similar tissue specificity. Shannon entropy equals log2(number of organs) when the gene expressed uniformly in all organs, and equals zero if gene expressed in a single organ. D Distribution of potential lncRNA target sites across genic elements.

