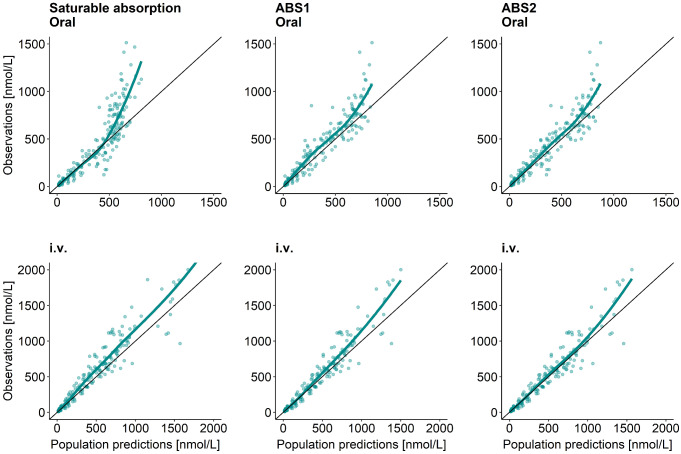
Fig. 3.
Goodness of fit plots (observations versus population predictions for different hydrocortisone absorption models: Left panels for the original saturable absorption model [20], middle panels for developed ABS1 (“split-dose”) model, right panels for developed ABS2 (“estimating number of transit compartments”) model. Top panels for 20 mg oral hydrocortisone administration and bottom panels for 20 mg intravenous (i.v.) bolus hydrocortisone administration

