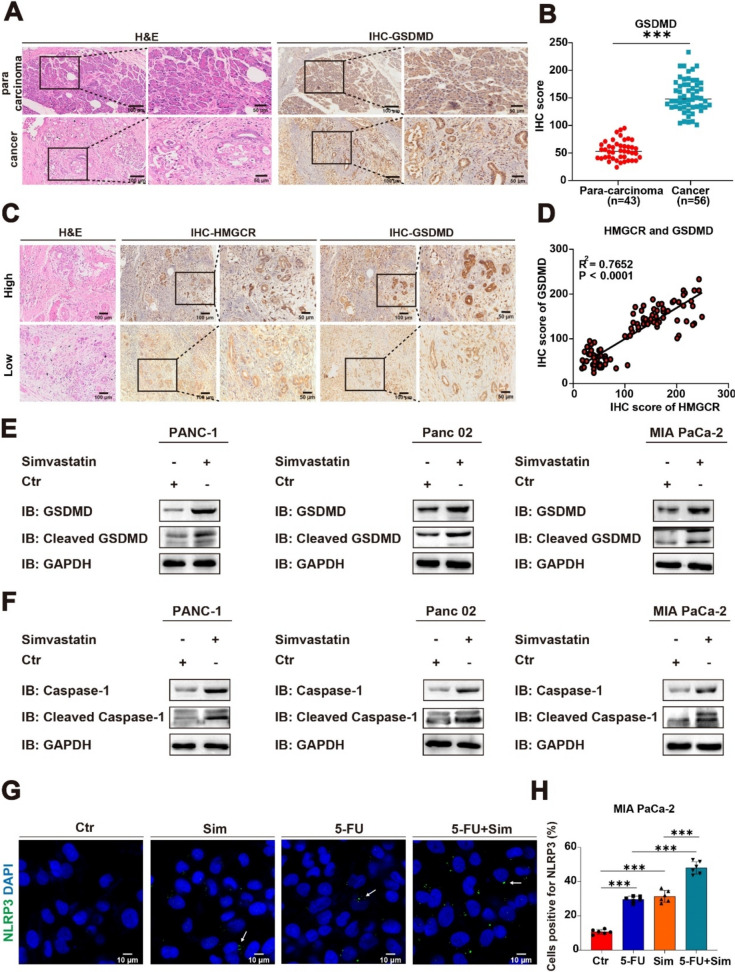
Fig. 2.
Targeting the mevalonate pathway causes pyroptosis. A-B Symbolic H&E staining and IHC staining of pathological tissues from PC patients, along with the IHC score. Results are presented as mean ± standard deviation. Student’s t test. ***P < 0.001. C Representative IHC staining images of high and low levels of HMGCR and GSDMD. D The protein level correlation between HMGCR and GSDMD in patients with PC from our cohort (n = 56) using linear regression analysis. E–F Immunoblotting assay showing the protein level of pyroptosis marker protein in control (Ctr) and treatment (simvastatin, 5 μM) of PANC-1, Panc 02, and MIA PaCa-2. G-H Representative IF staining images and quantification on the induction of pyroptosis in MIA PaCa-2 cells by simvastatin and 5-FU, either alone or in combination. White arrow, the inflammasome. Results are presented as mean ± standard deviation. Student’s t test. ***P < 0.001

