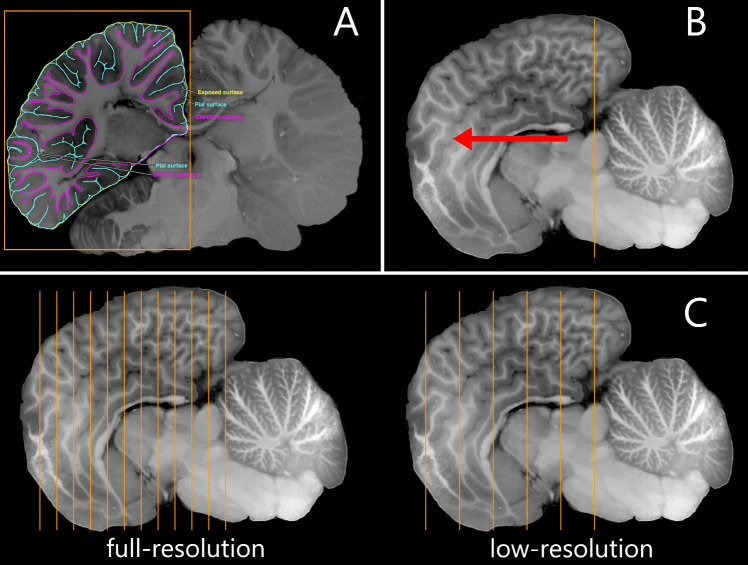
Fig. 2.
Visual guide of the data preparation for processing on Stitcher. A Example of a segmentation of gray matter, white matter and exposed surface ROIs; adapted from Avelino-de-Souza et al. (2024). B Sagittal view of the same brain; adapted from Avelino-de-Souza et al. (2024). The orange stripe shows the the first slice of segmentation and the red arrow indicates the direction of subsequent slices that must be segmented. C Stack of segmented slices, at full resolution (left), using all available slices; and at low resolution (right), using every other slice

