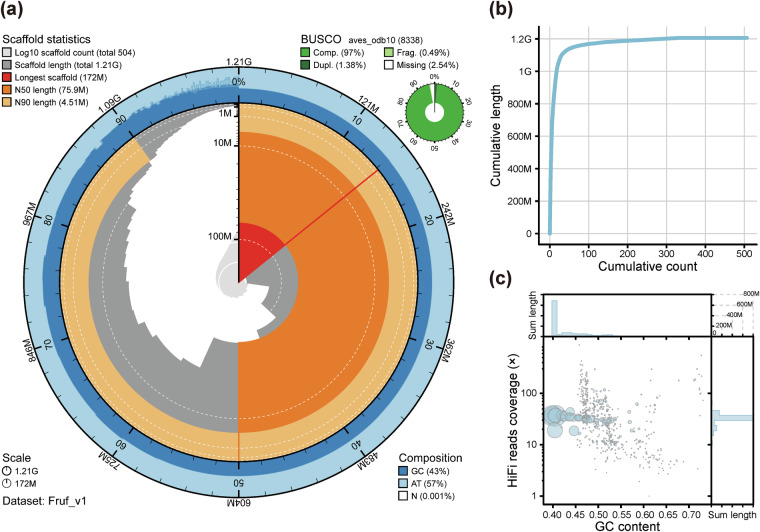
Fig. 2.
Overview of the genome assembly for Fulvetta ruficapilla. (a) Snail plot of summary statistics of the genome assembly on total length, scaffold length, BUSCO completeness in assembly, and base composition. (b) Cumulative length distribution versus cumulative count of the assembled scaffolds. (c) Distributions of GC content and coverage depth of HiFi reads across the scaffolds. The larger of the circle indicates the longer of the scaffold. All plots were generated by BlobTools2 in the BlobToolKit (v4.3.5)50. The BUSCO results were generated by BUSCO v5.5.0 and fed into the BlobTools2 plotting.

