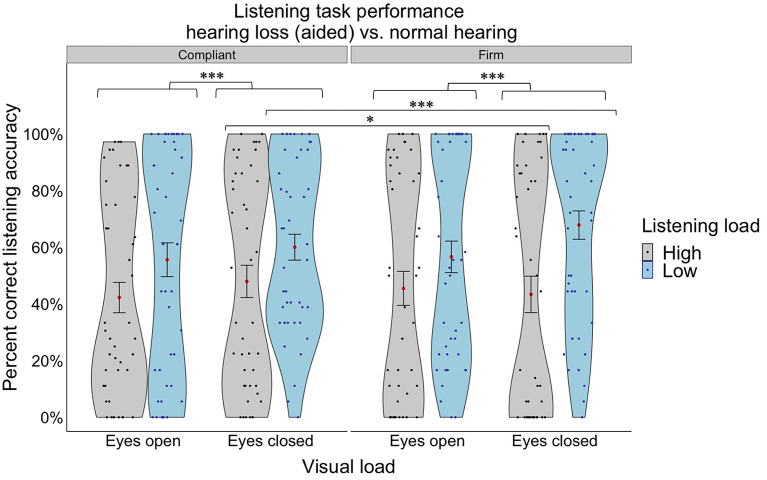
Fig. 5.
Percent correct listening accuracy collapsed across the hearing loss group (aided) and normal hearing group under different listening loads (high, low) and visual loads (eyes open, eyes closed). The violin plot represents the frequency of the data at a particular value along the y-axis with the standard error. The red dot represents the mean. The individual points represent each participant’s average for each listening and visual load combination. Statistical significance was determined using an ANOVA with a significance level of p < 0.05*.

