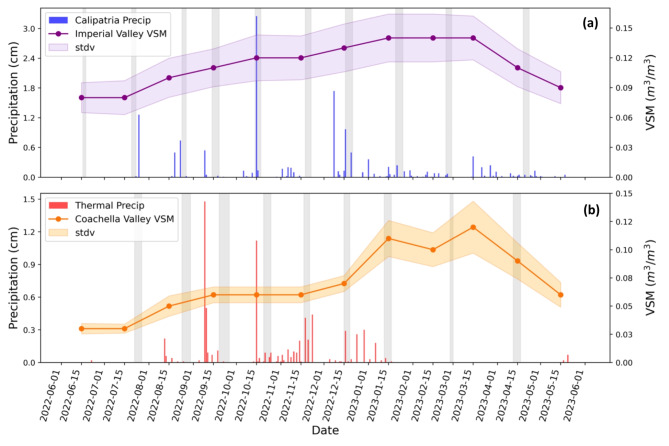
Fig. 6.
Monthly average Volumetric Soil Moisture, VSM (2022–2023, shown as a line plot), and the standard deviation (shown with shading) in (a) Imperial Valley and (b) Coachella Valley compared to the total daily precipitation (2022–2023, shown as bars) at our field sampling sites. Precipitation data was obtained from AQMIS and CIMIS and VSM data was obtained from NASA’s SMAP satellite. The grey boxes indicate our sampling dates at each site.

