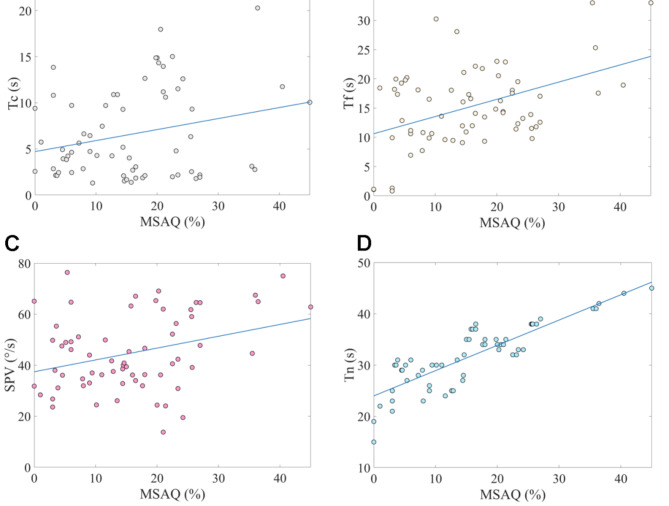
Fig. 5.
(A) Scatter plot of MSAQ scores and the cupula time constant from 65 volunteers. Tc represents the cupula time constant. Pearson correlation coefficient = 0.25, P = 0.04. (B) Scatter plot of MSAQ scores and the velocity storage time constant from 65 volunteers. Tf represents the velocity storage time constant. Pearson correlation coefficient = 0.45, P = 2e-4. (C) Scatter plot of MSAQ scores and the nystagmus SPV from 65 volunteers. Pearson correlation coefficient = 0.32, P = 9.7e-3. (D) Scatter plot of MSAQ scores and the nystagmus duration from 65 volunteers. Tn represents the nystagmus duration. Pearson correlation coefficient = 0.84, P = 1.68e-18.

