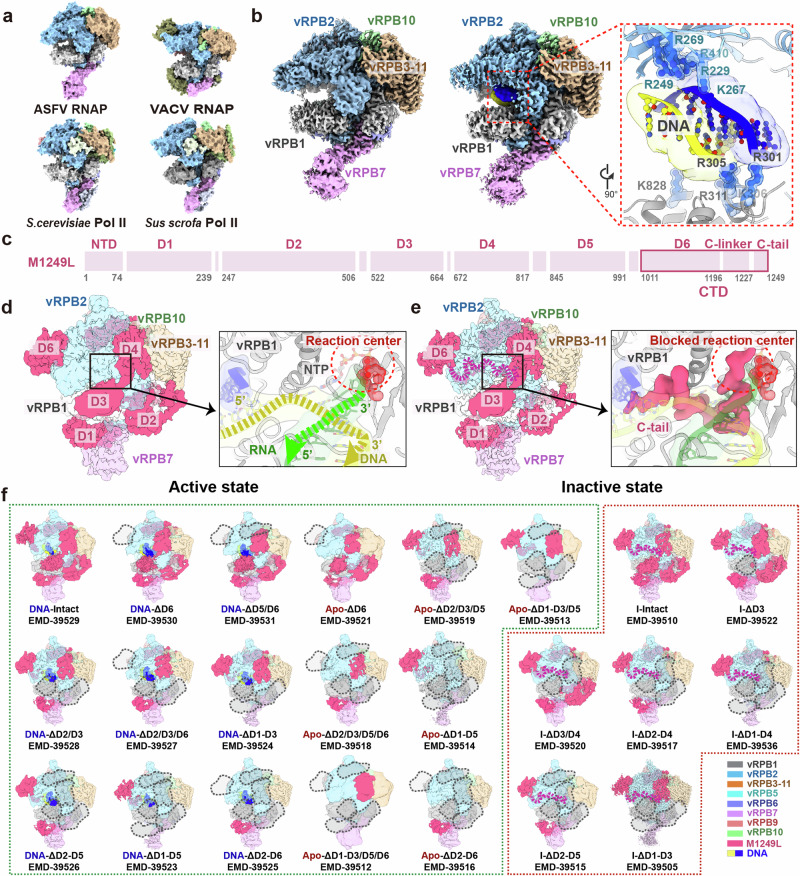
Fig. 2. Architectures of ASFV core vRNAP and vRNAP-M1249L complex.
a Comparison of ASFV vRNAP (8YQV) to S.cerevisiae (PDB: 1WCM), VACV (PDB: 6RIC), and Sus scrofa (PDB: 7EG7) depicted in surface representation. Homologous subunits are colored accordingly. b Structural comparison of core vRNAP (8YQV) with vRNAP-nucleic acid complex (8YQZ), in surface representation. We fitted a segment of B-type DNA (the yellow/blue chains represent double stranded DNA, from PDB: 7EG7) into the nucleic acids map. The closed-up view presents key amino acids involved in interaction with nucleic acid, depicted in cartoon. The labeled amino acids are color-coded to match the subunits’ colors. c Domains of M1249L, with the magenta box highlighting D6, C-linker and C-tail within C-terminal domain (CTD). d The map of vRNAP-M1249L complex without C-linker/C-tail (left), and close-up view of the active state of vRNAP (right). Colors of vRNAP subunits are consistent with (f). By adjusting transparency, density of M1249L obscured by polymerase subunits is revealed. The active site is depicted in cartoon to highlight details. The red circle indicates the position of reaction center. In active state, the active site lacks density of M1249L C-tail. Yellow and green arrows indicate the moving directions of DNA template and nascent mRNA. A nucleotide triphosphate (NTP) molecule was modeled within the NTP entry channel, depicted in red. e The map of vRNAP-M1249L complex with C-linker/C-tail (left), and close-up view of inactive state of vRNAP (right). The magenta dashed lines emphasize positions of C-linker and C-tail. In this state, density of the M1249L C-tail domain is prominently displayed, with C-terminal penetrating into the reaction center, thereby hindering binding of nucleic acids and NTP. f Dynamic variations of M1249L in two states are depicted across 23 distinct cryo-EM maps. The color scheme for each subunit is indicated at the right bottom of the panel. Green dashed box illustrates the dynamics of M1249L domains in active state. Gray dashed boxes denote the absence of domain density at that specific position of M1249L. Red dashed box signifies the dynamics of M1249L in inactive state, with magenta dashed lines emphasizing positions of C-linker and C-tail.

