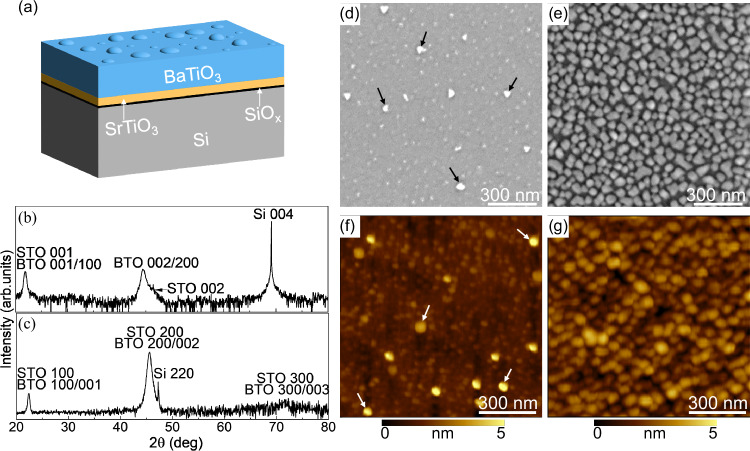
Fig. 1. Structural characterization of the sample.
a Schematic diagram of the epitaxial BaTiO3/SrTiO3/Si stack with nanoislands, (b) θ/2θ X-ray diffraction pattern of the heterostructure, (c) in-plane X-ray diffraction pattern of the heterostructure, (d, e) SEM and (f, g) AFM images showing the two different densities of BaTiO3 nanoislands for two different Sr fluxes in the passivation step. Some of the nanoislands in (d, f) are highlighted with arrows.

