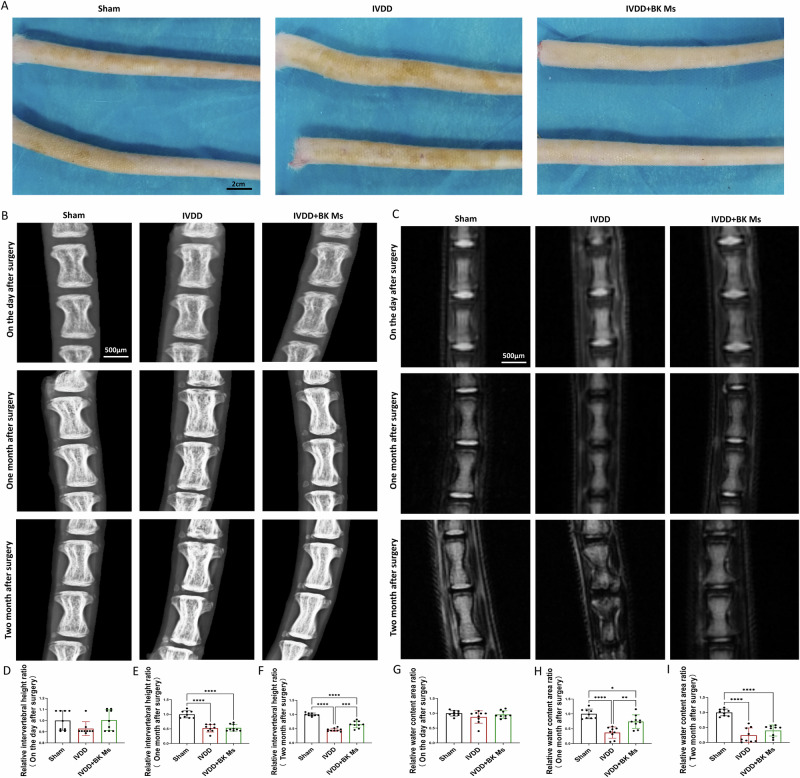
Fig. 7. Post-surgical assessment of tail conditions in mice: X-ray, MRI, and intervertebral disc analysis.
A General photos of the tails of mice in each experimental group 2 months after surgery. B X-ray performance of tails of mice in each experimental group after surgery, 1 month, and 2 months. C MR performance of tails of mice in each experimental group on the day after surgery, 1 month, and 2 months. D Intervertebral disc height ratio one day after surgery. E Intervertebral disc height ratio one month after surgery. F Intervertebral disc height ratio two months after surgery. G Relative moisture content one day after surgery. H Relative moisture content one month after surgery. I Relative moisture content two months after surgery. To assess the statistical differences between various groups, we employed one-way analysis of variance (ANOVA) followed by Tukey’s post hoc test for multiple comparisons (*: p < 0.05, **: p < 0.01, ***: p < 0.001, ****: p < 0.0001). At each time point, each group consisted of three rats (n = 3).

