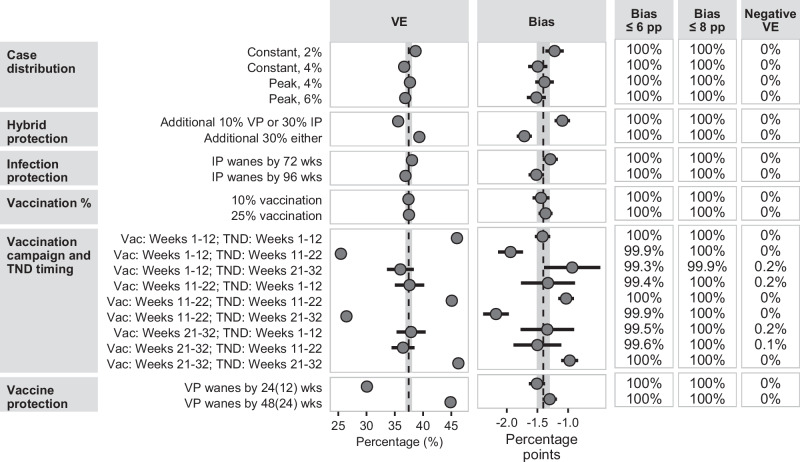
Fig. 3. Plot of estimated marginal means of unadjusted VE (not controlling for prior infection) against symptomatic infection, bias compared to adjusted VE (controlling for prior infection) against symptomatic infection, the percentage of simulations with a bias less than or equal to 6 percentage points (pp), 8 pp, and VE estimate less than zero (negative VE) for people vaccinated in the previous 3 months.
Estimates were generated from a meta-regression of aggregated results from 768 simulation conditions (each of which was summarized from 1000 simulations) after controlling for all other simulation parameters. Bias was computed as the difference between the unadjusted VE estimate compared to the VE estimate adjusted for prior infection. Estimates are presented as the marginal mean (as dots) +/− the 95% confidence interval (represented by solid lines) that are a product of the standard error and normal distribution quantiles. The bars may be narrower than the dot and not visible. The dashed line and shaded region in the VE column represent the overall mean and the 95% confidence interval, respectively, from Fig. 1. In the Bias column, the dashed line and shaded region represent the overall mean and the 95% confidence interval, respectively, from Supplementary Fig. 21.

