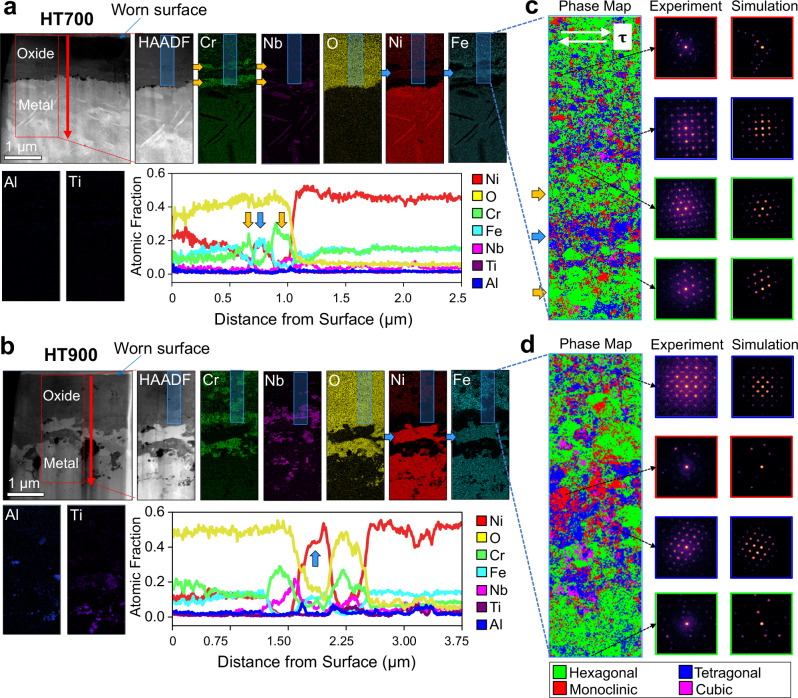
Fig. 4. Microstructure and phase distribution in the surface oxide.
a, b HAADF-STEM images of the HT700 and HT900 cross-sectional samples followed by elemental maps for Nb, O, Ni, Fe, Al, and Ti corresponding to the areas enclosed by the dashed red boxes and averaged elemental line profiles starting from the surface of the sample going downward in the red arrow direction. c, d Phase map analysis of the areas enclosed by the shaded blue boxes in the HT700 and HT900 sample images shown in (a) and (b), respectively. White arrows in (c) represent the sliding direction. Yellow and blue arrows in (c) represent corundum-structured and spinel-structured metal oxide layer, respectively. Hexagonal (167), tetragonal (98), monoclinic (12), and cubic (227) phases are represented by the green, blue, red, and magenta-colored regions, respectively. SG represents the space group. AP and HT represent as-printed and heat-treated, respectively. Example NBED patterns and their corresponding Bloch wave simulation matches are shown outlined with their color-coordinated phase match.

