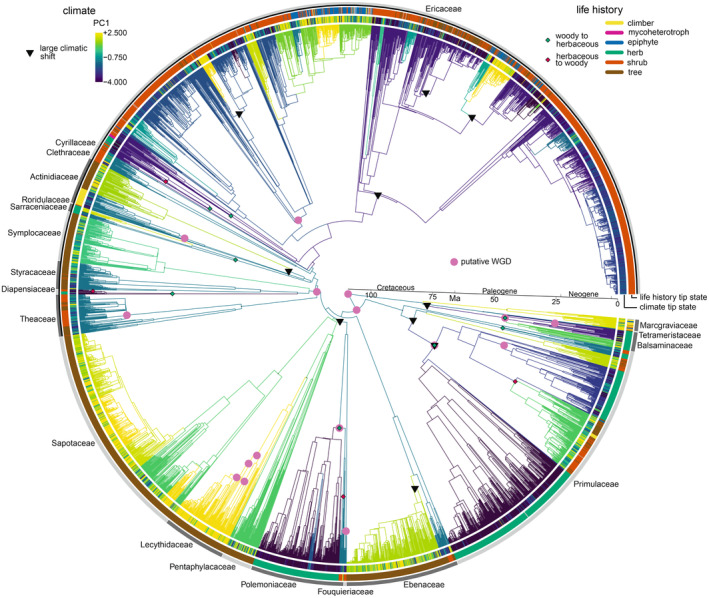
Fig. 2.

Time‐calibrated phylogenetic tree for Ericales estimated from chloroplast+ITS data and 14 fossil calibrations. Pink circles indicate putative WGDs (there is some uncertainty about the placement of these; see text). Black triangles are large climatic shifts estimated by sister‐clade comparison. Branch colours represent the climatic optima (on PC1) estimated by l1ou, and the observed climatic preference at the tips is shown on the innermost ring around the edge of the phylogenetic tree. These climatic variables correspond to the PC1 scale shown. Diamonds indicate estimated life‐history shifts: green are from woody to herbaceous, and red are from herbaceous to woody. The observed life‐history state at the tips is shown on the second ring around the edge of the phylogenetic tree, with colours corresponding to the key shown. The outermost ring represents the different families. The black line in this ring, which extends from Theaceae to Ericaceae, corresponds to core Ericales.
