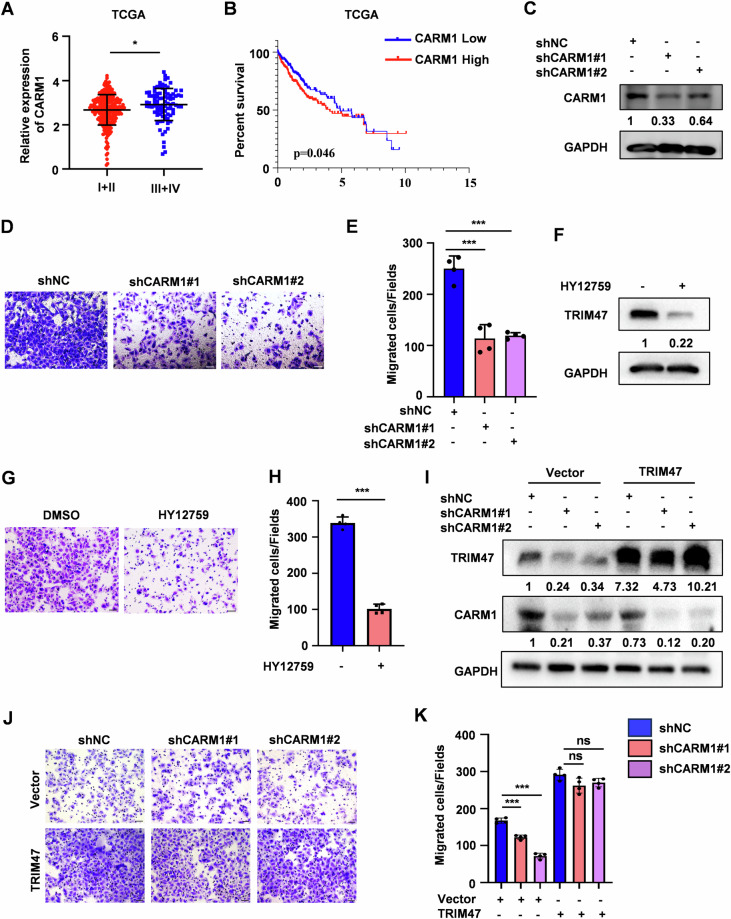
Fig. 4. CARM1 promotes HCC cells migration depend on TRIM47.
A Analysis of CARM1 mRNA levels in different tumor stages (stag III + IV vs stag I + II) of HCC patients from TCGA database. *P < 0.05. B Kaplan–Meier survival analysis of overall survival (OS) stratified by CARM1 expression in the HCC tissues from TCGA database. P = 0.046. C Western blot analysis of CARM1 protein levels in CARM1 stably knockdown (shCARM1#1 and shCARM1#2) or control (shNC) SMMC7721 cells. D, E The migration assay of SMMC7721 cells with CARM1 stably knockdown (D). The average number of cells per field were calculated (E). Scale bars, 50 μm. Data shown as mean ± SD. n = 3 samples per group, four fields per sample. ***P < 0.001. F Western blot analysis of TRIM47 protein levels in SMMC7721 cells treated with HY12795 (10 μM) for 8 h. G, H The migration assay of SMMC7721 cells treated with HY12795 (10 μM) for 8 h (G). The average number of cells per field were calculated (H). Scale bars, 50 μm. Data shown as mean ± SD. n = 3 samples per group, four fields per sample. ***P < 0.001. I–K CARM1 stable knockdown SMMC7721 cells were transfected with Vector or FLAG-TRIM47. Cells were harvested and subjected to western blot (I) and migration assay (J). The average number of cells per field were calculated (K). Scale bars, 50 μm. Data shown as mean ± SD. n = 3 samples per group, four fields per sample. ***P < 0.001; ns no significance.

