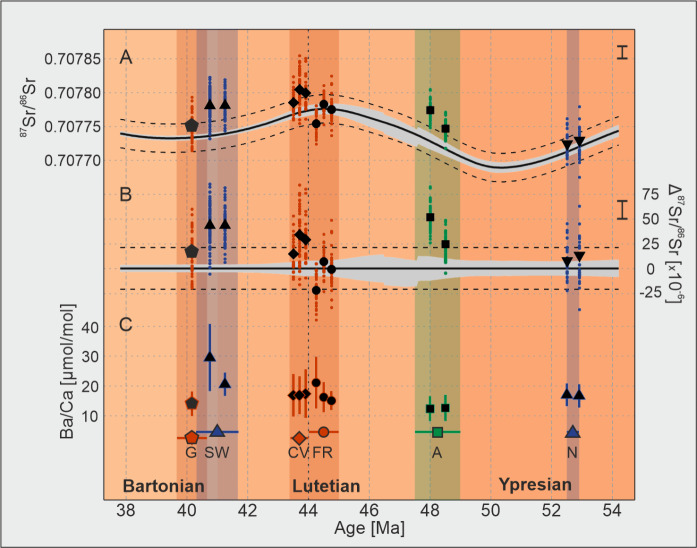
Fig. 2.
Strontium isotopic composition and barium baseline values of the fossil bivalve shells. (A) mean values (black symbols) and single measurements (coloured points) of 87Sr/86Sr from bivalve shells; the Eocene global seawater 87Sr/86Sr reconstruction is from McArthur et al.23 (black curve, grey shading—uncertainties of the LOWESS fit) with modern oceanic water 87Sr/86Sr variability (± 21 × 10−6, dashed lines)6; average standard error for single measurements is displayed by the black vertical bar (2 SE = 18 × 10−6); (B) mean values (black symbols) and single measurement (coloured points) of 87Sr/86Sr from bivalve shells normalised to the relevant Eocene seawater 87Sr/86Sr value23; the seawater 87Sr/86Sr value for normalisation is that for the mean age of each sampling site (Supplementary Material 2); average standard error for single measurements is displayed a black vertical bar (2 SE = 18 × 10−6); (C) bivalve shell Ba/Ca baseline (± 2SD); coloured symbols indicate mean age and horizontal bars, while the shaded areas show the age uncertainty for each sampling location, in which the plotted samples may fall (Table 1); G Le Guépelle, SW Studley Wood, CV Chaumont-en-Vexin, FR Fleury-La-Rivière, A Aalter, N Nursling; basins are indicated by colour: Paris Basin — red, Hampshire Basin — blue, Belgian Basin — green. Eocene stages are shown in the same colours as the geological time scale24.

