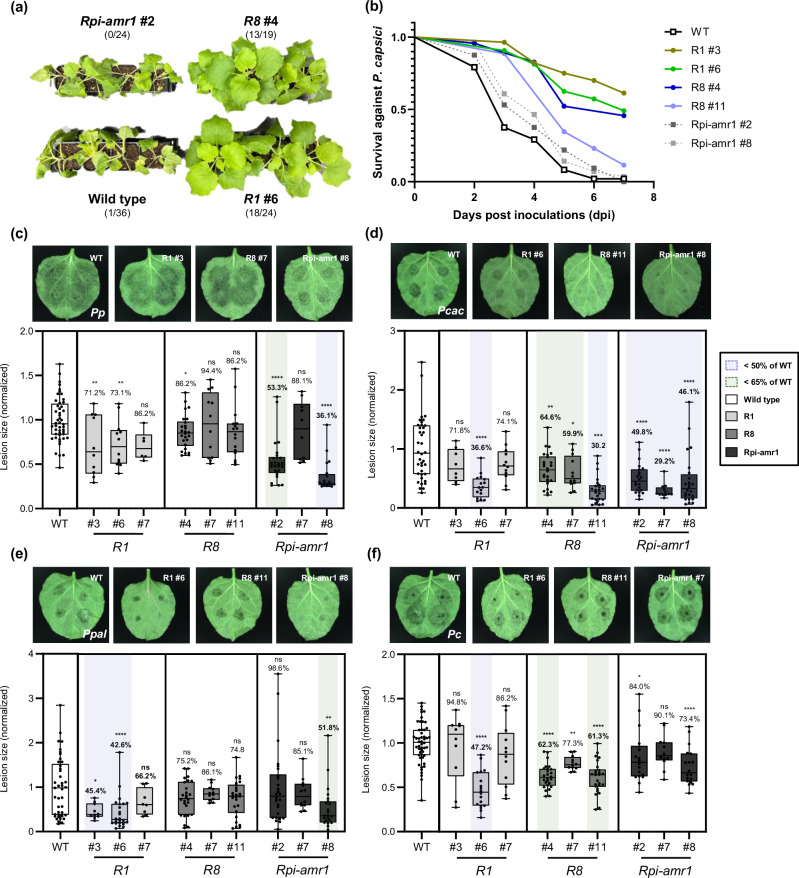
Fig. 3. Transgenic N. benthamiana expressing R1, R8, or Rpi-amr1 conferred resistance against multiple Phytophthora species.
a Representative images for the P. capsici root infection assay. T1 plants expressing R1 or R8 exhibited significant resistance against P. capsici compared to the wild type or T1 Rpi-amr1 plants. The number of healthy/tested plants are described as fraction. b Survival rate (healthy/tested plants) of each transgenic line in P. capsici root infection assay (combined results obtained from three independent trials) is presented as line graph. Phenotypes were observed until all wild type plants were completely wilt. c–f Representative images of (c) P. patasitica 40402 (Pp); (d) P. cactorum 40166 (Pcac); (e) P. palmivora 40410 (Ppal); and (f) P. capsici 40476 (Pc) lesions inoculated on wild type (WT), R1, R8, or Rpi-amr1 transgenic plants (upper) and the average lesion size of each case is presented with box plot, the dots show individual values, while the boxes display the first quartile, median, and third quartile, with whiskers extending to the smallest and largest values. Average lesion size of each pathogen on the WT plant were normalized to 1.0, and the ratio of average lesion size on transgenic/WT plant are marked as percentage above each box (for the cases of average lesion size of transgenic/WT plant < 50% and < 65%, are marked with blue and green shades, respectively). Statistical significances were calculated from unpaired t-test (two-tailed *P < 0.05; **P < 0.01; ***P < 0.001; ****P < 0.0001).

