. 2024 Oct 30;23:1330–1352. doi: 10.17179/excli2024-7707

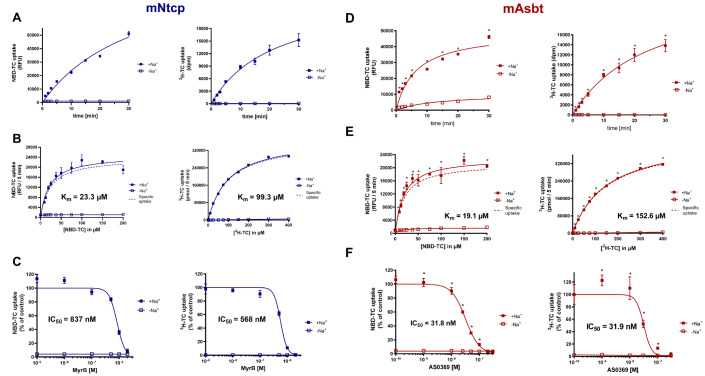
Figure 4. Transport kinetics of 3β-NBD-TCA compared to [3H]-TCA in mNtcp-HEK (A-C) and mAsbt-HEK (D-F) cells. (A, D) Time-dependent uptake in the presence (+Na+) and absence (-Na+) of sodium in the transport buffer up to 30 min. (B, E) Concentration-dependent uptake in the presence (+Na+) and absence (-Na+) of sodium in the transport buffer up to 50 µM. The carrier-specific uptake was calculated by subtracting the uptake under sodium-free conditions (dashed line). (C) Inhibition of the mNtcp-mediated BA transport by Myrcludex B (MyrB) and (F) inhibition of the mAsbt-mediated BA transport by AS0369 at increasing inhibitor concentrations. Half-maximal inhibitory concentrations (IC50) were calculated by non-linear regression analysis. Data represent means ± SD of quadruplicate determinations of representative experiments. *Significantly higher uptake compared to control; Unpaired t test, p < 0.0001.

Figure 4