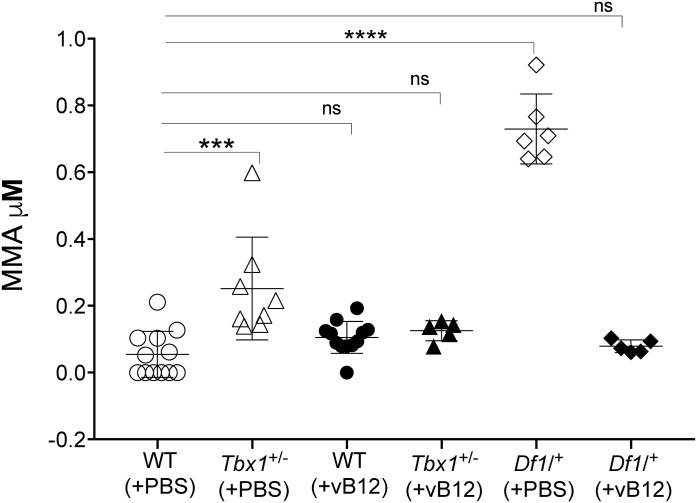
Figure 3. Vitamin B12 treatment restores MMA to WT levels in Tbx1+/− and Df1/+ mice.
The abundance of MMA (μM, mean ± SEM) was evaluated in WT, Tbx1+/−, and Df1/+ mice treated with vB12 or PBS (vehicle). Differences between groups were evaluated by the ordinary one-way ANOVA test and the Holm–Sidak’s multiple comparison test (*P < 0.05, **P < 0.01, ***P < 0.001). The normal distribution was verified according to the D’Agostino and Pearson tests. Each symbol in the plot represents an individual animal.

