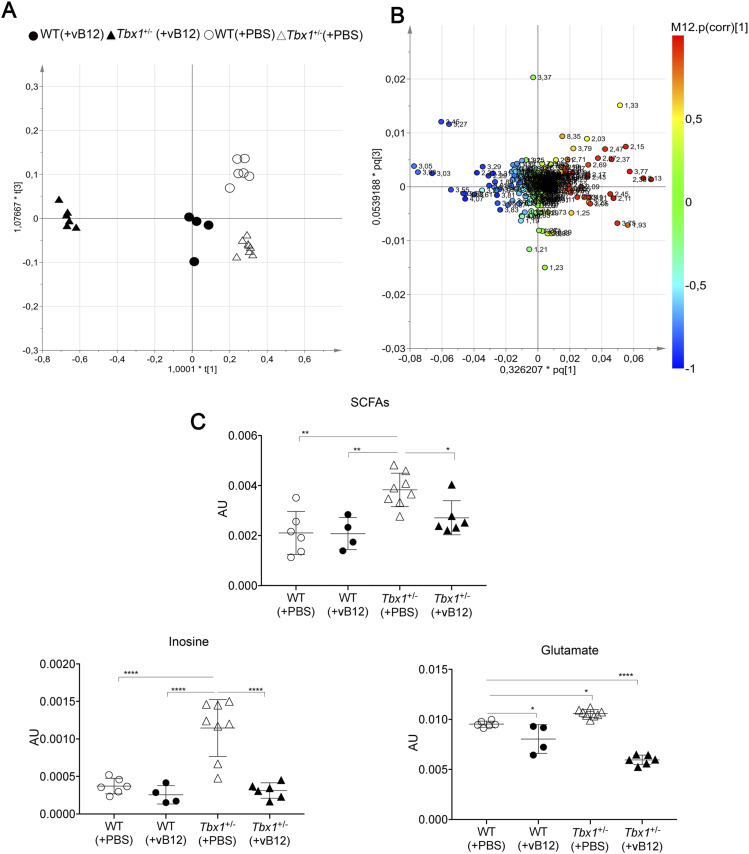
Figure 4. Metabolic profile of the Tbx1+/− brain after vitamin B12 treatment.
The metabolic profiles of Tbx1 mutant brain extracts were compared to those of WT brains with and without vB12 treatment. (A) Score plot obtained from the orthogonal partial least squares discriminant analysis of brain extracts (NMR data). (A, B) Loading plot associated with the score plot in (A) showing the NMR signals responsible for the data cluster. Each variable in the plot corresponds to a signal in the metabolic profile of the dataset. (C) Graphical representation of metabolites that were rescued in Tbx1+/− brains after vB12 treatment (inosine, glutamate, and SCFAs). Normalized bin intensities corresponding to rescued molecules are expressed in arbitrary units (*P < 0.01, **P < 0.005, ***P < 0.0005, ****P < 0.0001).

