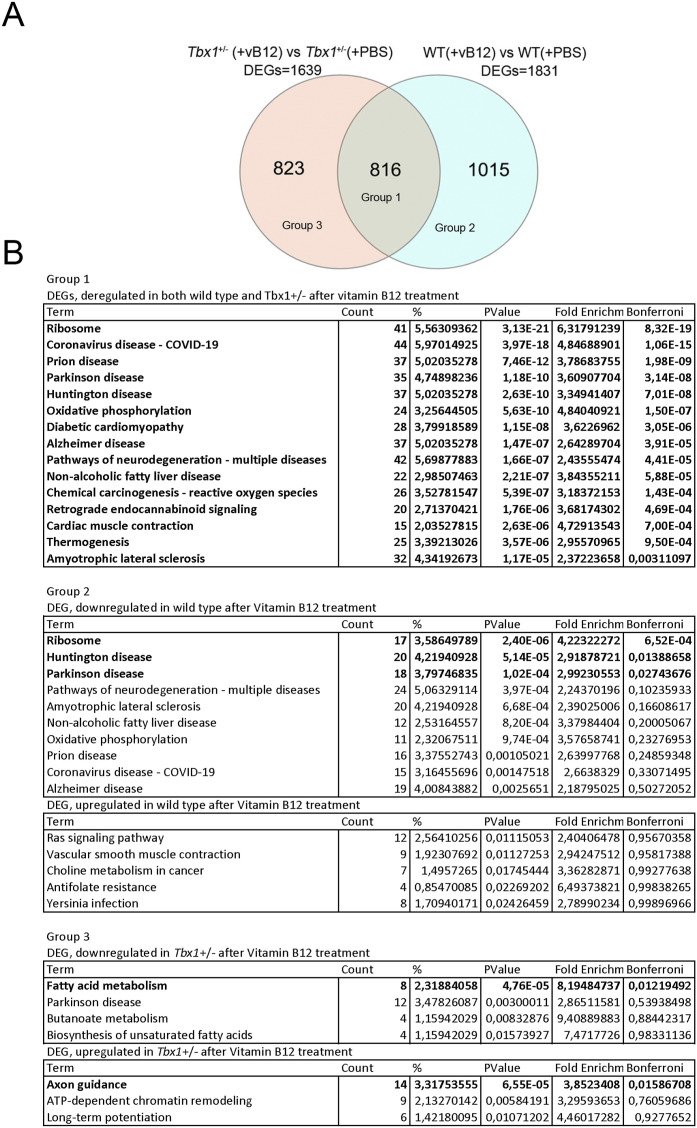
Figure 5. Vitamin B12 treatment has a genotype-specific impact on the brain transcriptional profile.
(A) Venn diagram representing the intersection of two groups of differentially expressed genes (DEGs): Tbx1+/−(+vB12) versus Tbx1+/− (+PBS) and WT(+vB12) versus WT(+PBS). Groups 1, 2, and 3 are defined in (B). (B) Gene ontology analysis (DAVID) of differentially down-regulated and up-regulated genes in each of the indicated groups: Group 1—differentially expressed genes deregulated in both WT and Tbx1+/− after vB12 treatment; Group 2—differentially expressed genes deregulated exclusively in WT after treatment; and Group 3—differentially expressed genes deregulated exclusively in Tbx1+/− after vB12 treatment.

