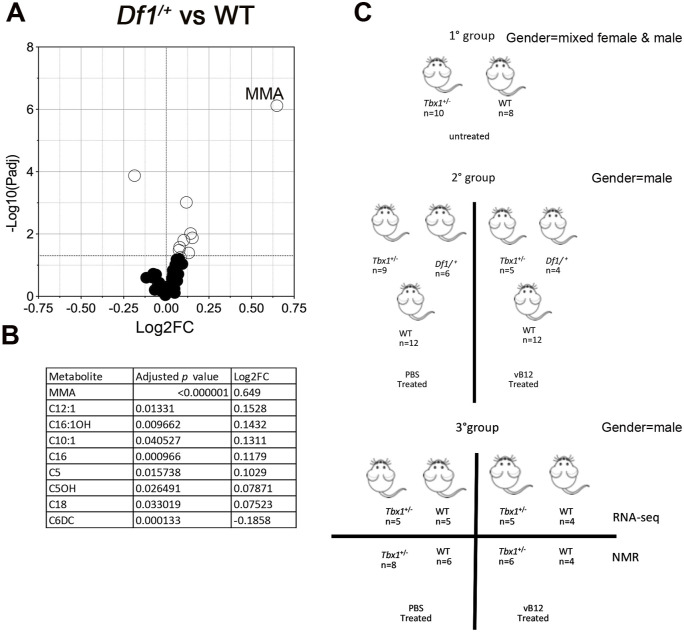
Figure S1. Metabolomic analysis in 22q11.2 mouse model and experimental schemes.
(A) Volcano plots showing differential concentrations of selected metabolites in Df1/+ versus WT samples obtained by LC-MS/MS. The white dots represent the significant differential metabolites, and the black dots, all the metabolites identified in the dataset, the relative abundance of which was not significantly different between the groups. (B) Differential metabolites are listed in the table accompanied by their corresponding values of difference (Log2FC, fold change) and adjusted P-values. (C) Cartoon showing the animals used in the study. Group 2 mice were obtained by intercrossing Tbx1+/− and Df1/+ mice.

