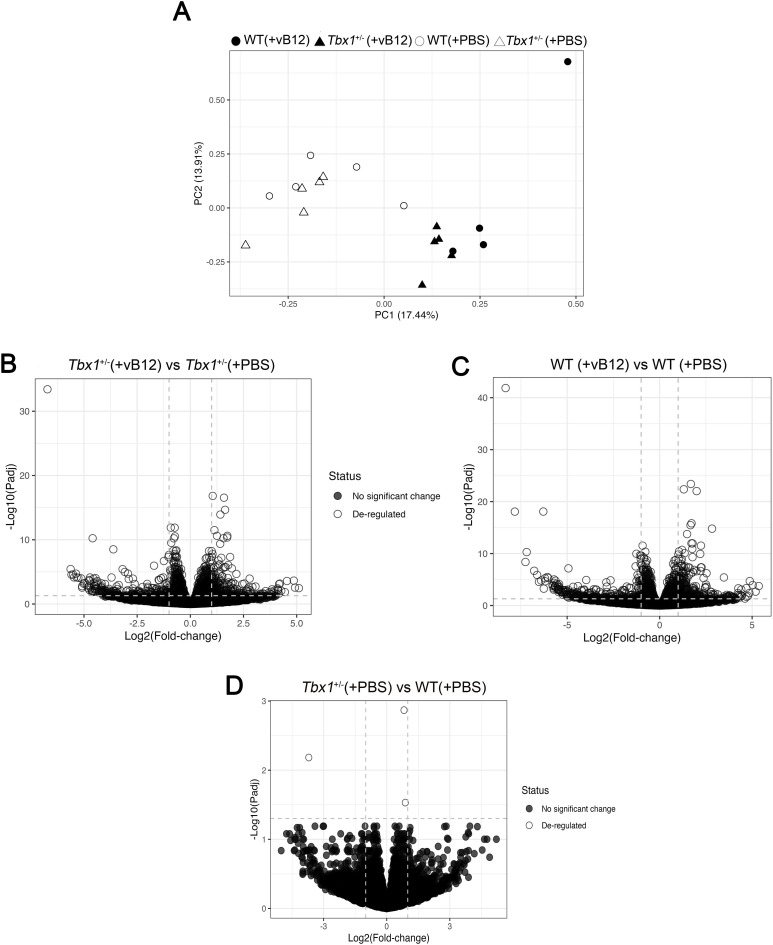
Figure S4. RNA-seq analysis of brain tissue of WT and Tbx1+/− mice treated with PBS or vB12 animals.
(A) PCA of all groups. Filled and open dots and triangles correspond to the transcriptional profile the genotype and treatment groups indicated in the key. (B, C, D) Volcano plots of differentially expressed genes from (B) Tbx1+/− (+vB12) versus Tbx1+/− (+PBS), (C) WT (+vB12) versus WT (+PBS), and (D) Tbx1+/− (+PBS) versus WT (+PBS).

