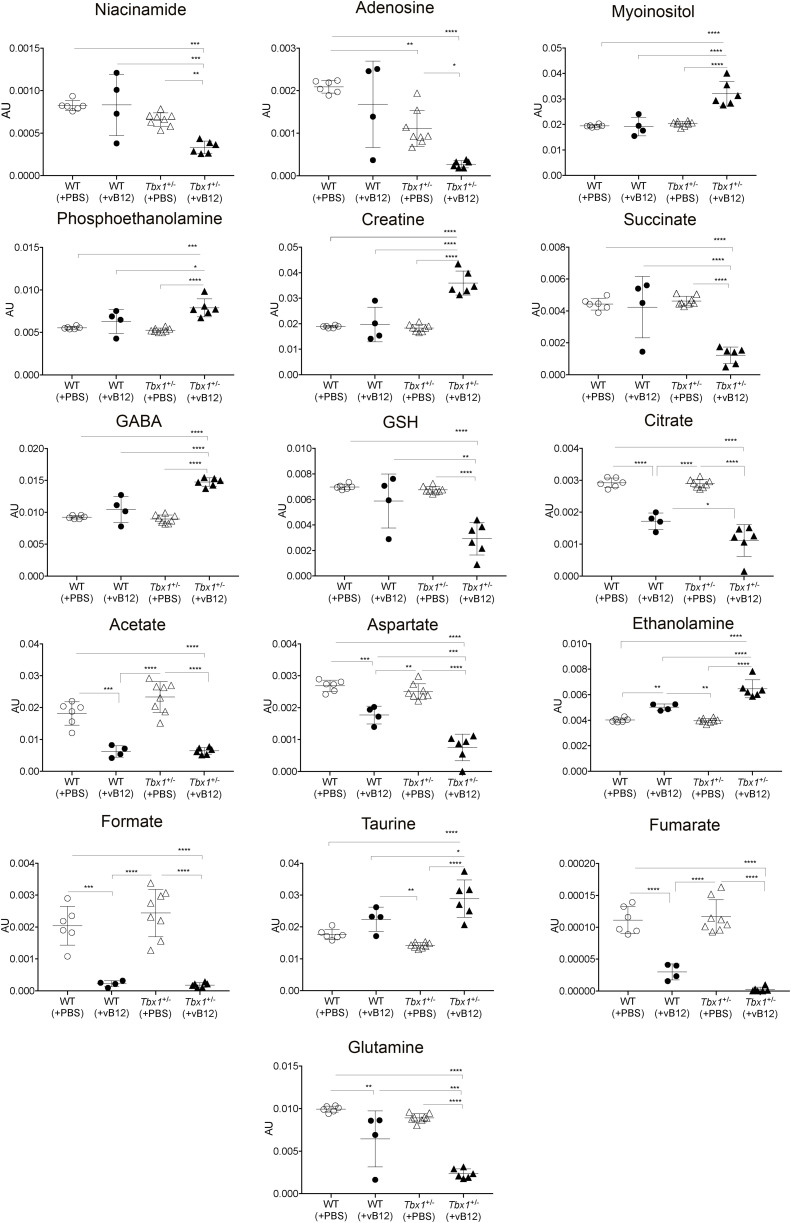
Figure S6. Graphical representation of all metabolites (bin intensities) in brain extracts that were significantly different between WT and Tbx1+/− mice treated with PBS or vB12.
Bin values were normalized to the total area of each spectrum and are therefore expressed in arbitrary units (AU). P < 0.05*, P < 0.01**, P < 0.001***, P < 0.0001****.

