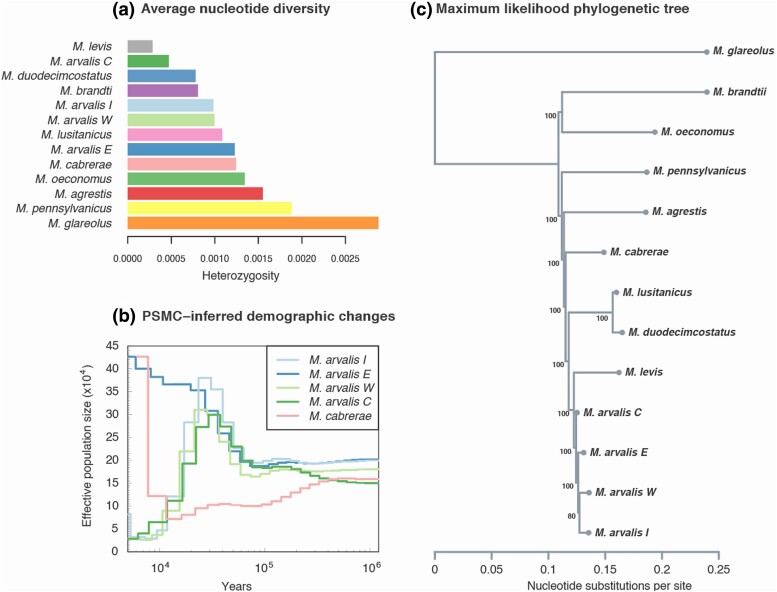
Fig. 2.
Broad patterns of diversity and divergence of resequenced individuals. Panel a) corresponds to the average nucleotide diversity (shown as heterozygosity) value per individual. PSMC-inferred effective population size evolution of five samples including the 4 M. arvalis lineages is also represented b). This population size estimated assumes a mutation rate of 8.7 × 10⁻⁹ per base pair per generation and a generation time of 0.5 yr. Finally, in panel c) we show the maximum-likelihood phylogenetic tree obtained with RAxML. The number of bootstrap replicates supporting this tree topology out of 100 is indicated next to each ancestral node.

