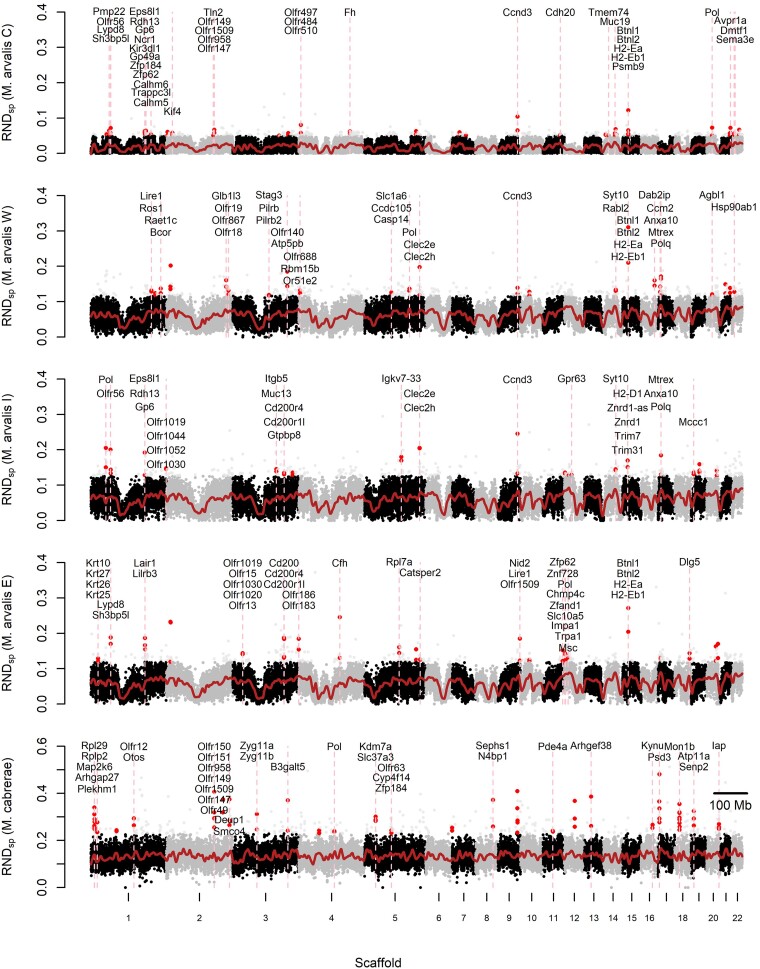
Fig. 3.
Genome scan for regions of high divergence in M. arvalis individuals and M. cabrerae (for other species, see supplementary fig. S6, Supplementary Material online and S7). For each sample, RNDsp values computed along 50 kb nonoverlapping windows are represented along the 22 largest scaffolds (gray and black colors indicate the alternance between scaffolds) against its closest relative which has the lowest dxy. The red line corresponds to a loess smoothing of RNDsp values. Red dots identify 50 kb windows found in stretches where at least two out of three consecutive windows have an RNDsp value in the top 1% of all values. Genes overlapping with such windows are mentioned along vertical pink lines.

