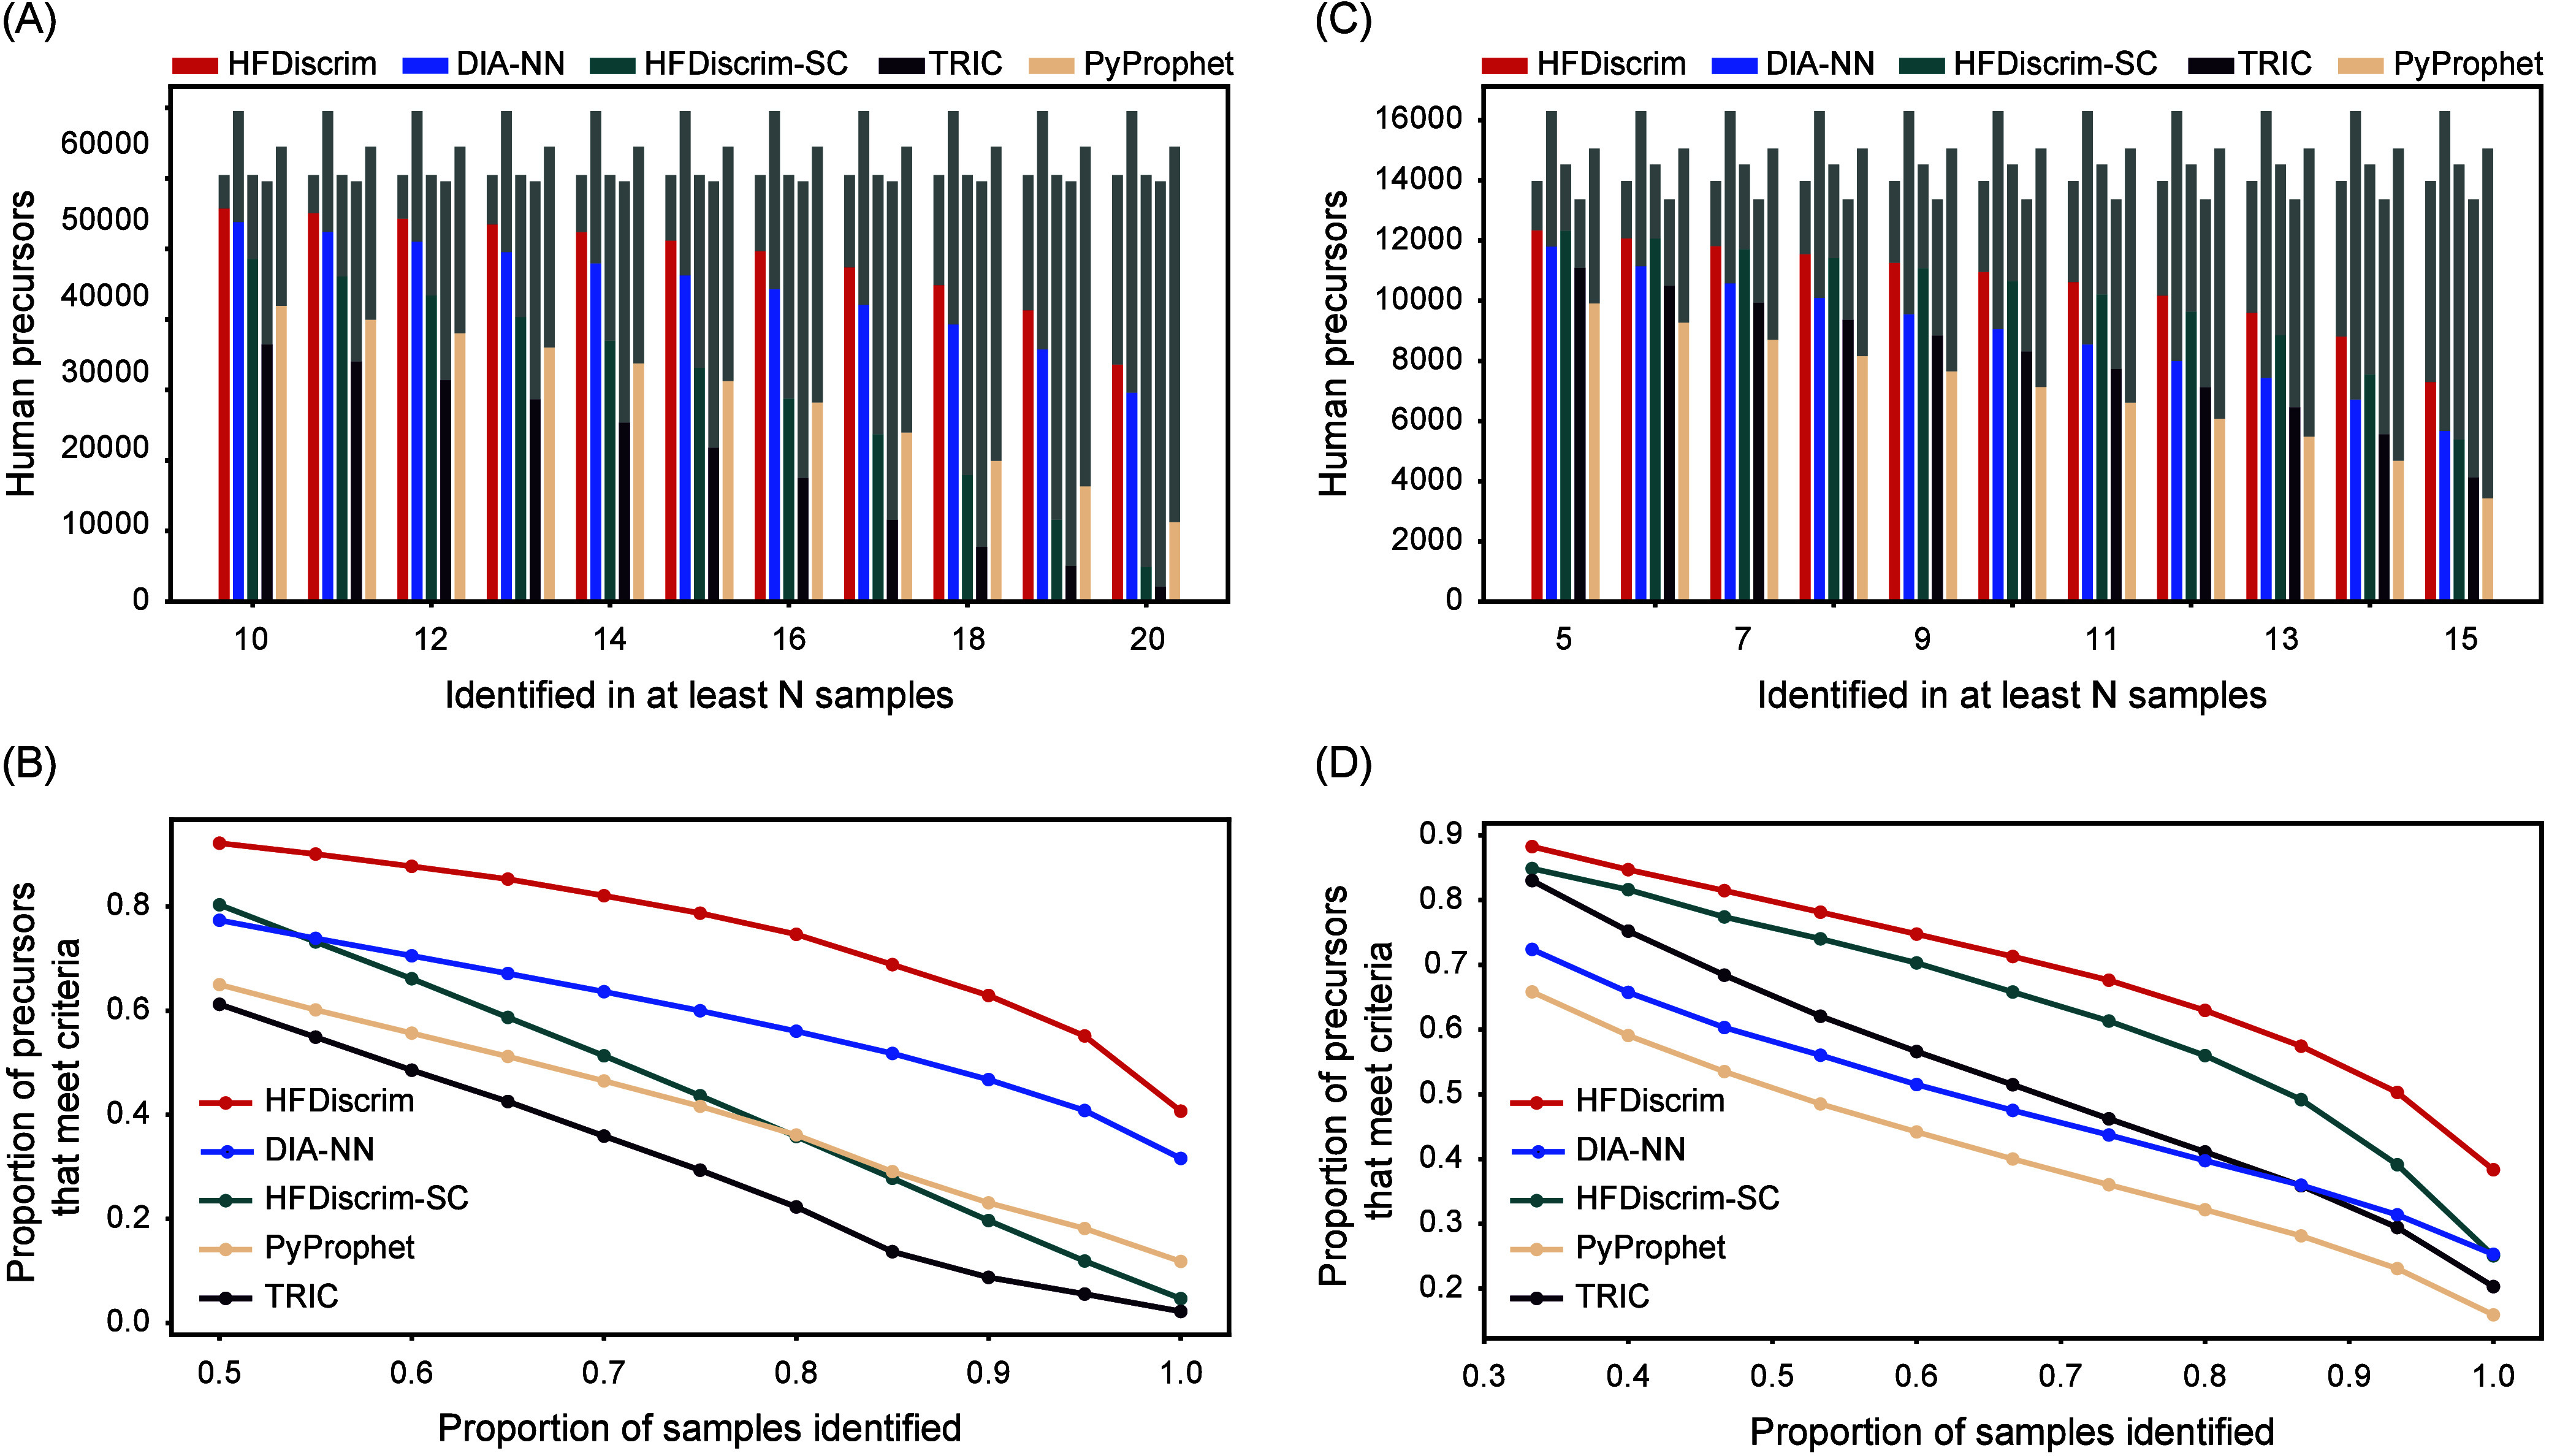
Figure 5.

Evaluation of identification results of HFDiscrim on the ccRCC and Prostate data sets. (A) Number of human precursors identified by HFDiscrim and other tools in at least N samples out of 20 runs in the ccRCC data set. The x-axis represents the number of samples (N) in which a precursor was identified, and the y-axis shows the count of identified human precursors. Color bars represent the number of precursors identified by each tool, and gray bars indicate the number of precursors not identified in N samples by the corresponding tools. (B) Relationship between the proportion of human precursors and the sample identification rate in the ccRCC data set. (C) Same as in (A) but for the Prostate data set. (D) Same as in (B) but for the Prostate data set.
